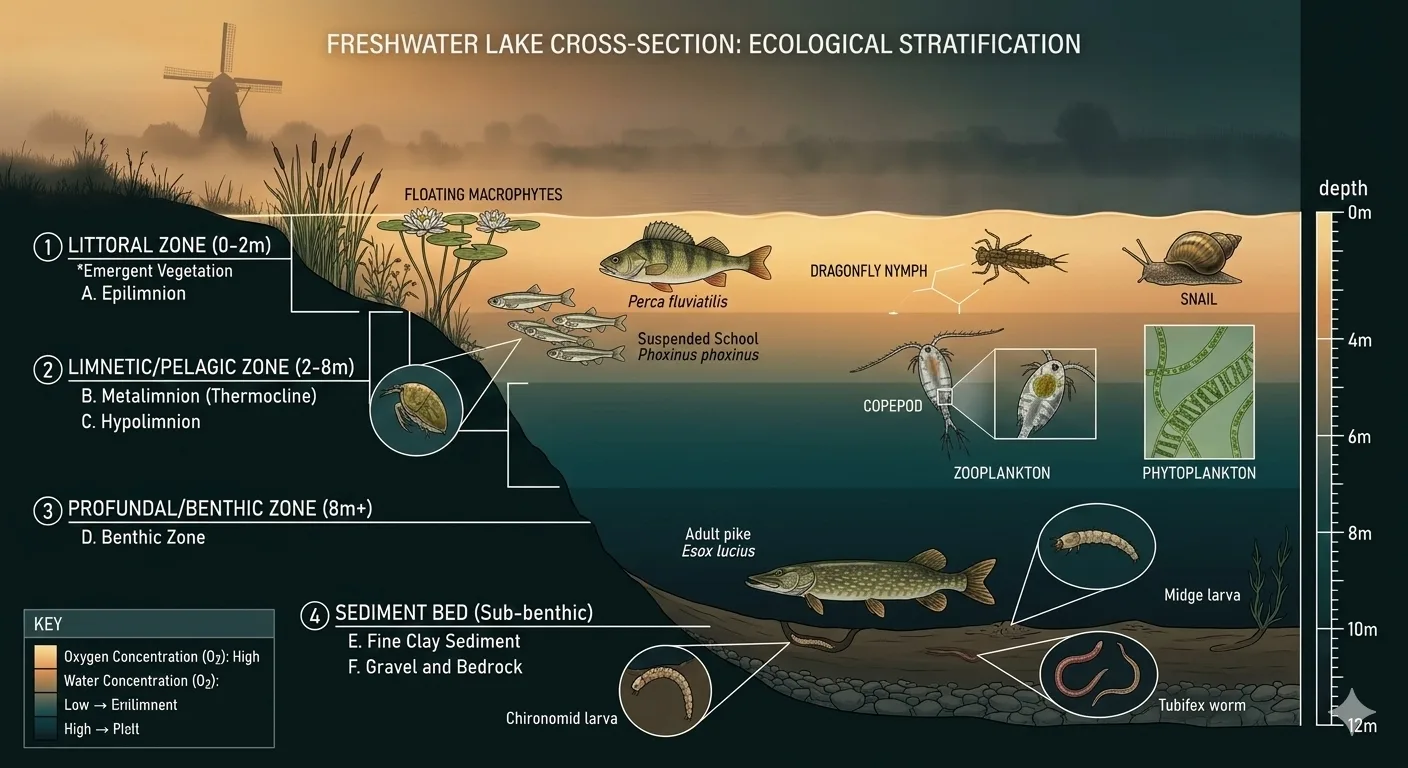
THE FOOD WEB
From Algae to Apex. Every Link Tracked.
Phytoplankton
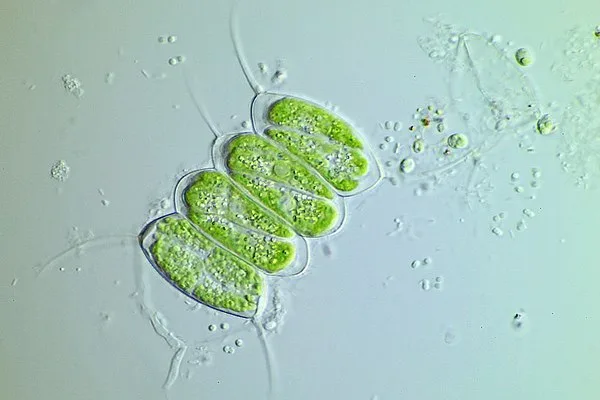 Scenedesmaceae
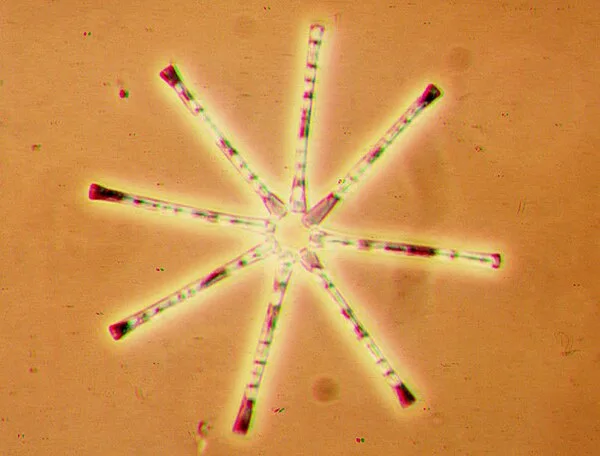 Fragilariaceae
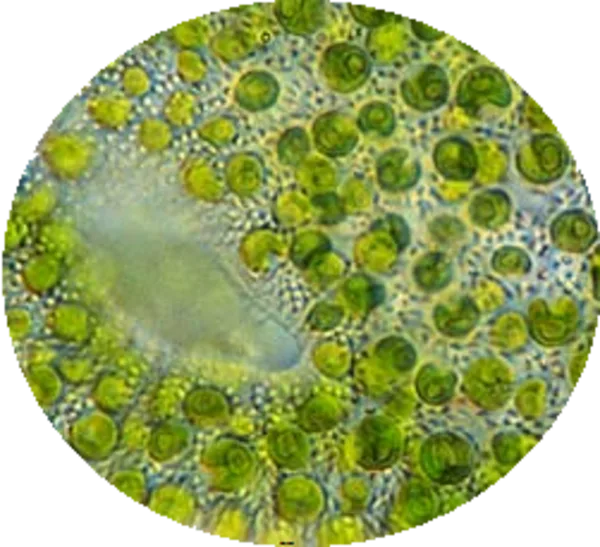 Chlorellaceae
Invertebrates
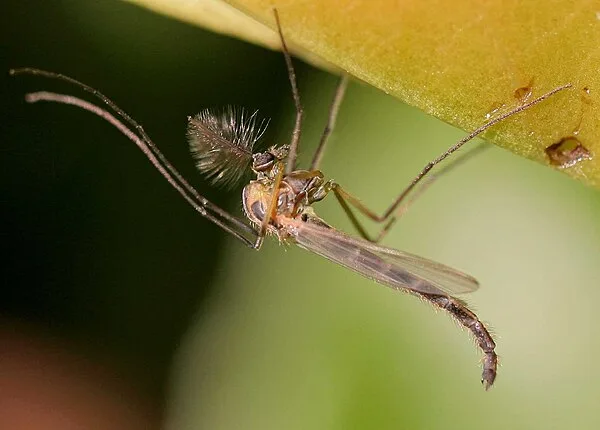 Chironomidae
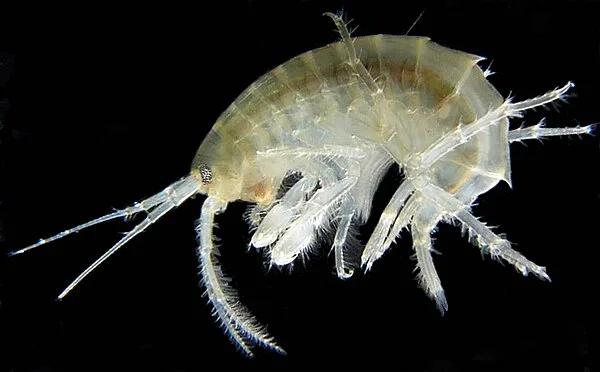 Gammaridae
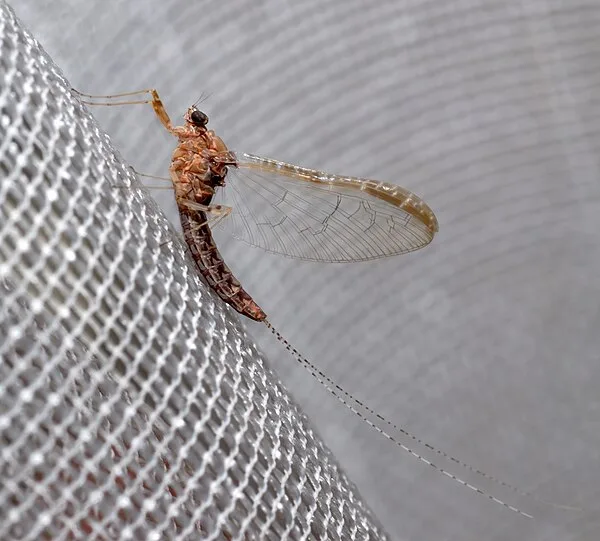 Baetidae
Prey Fish
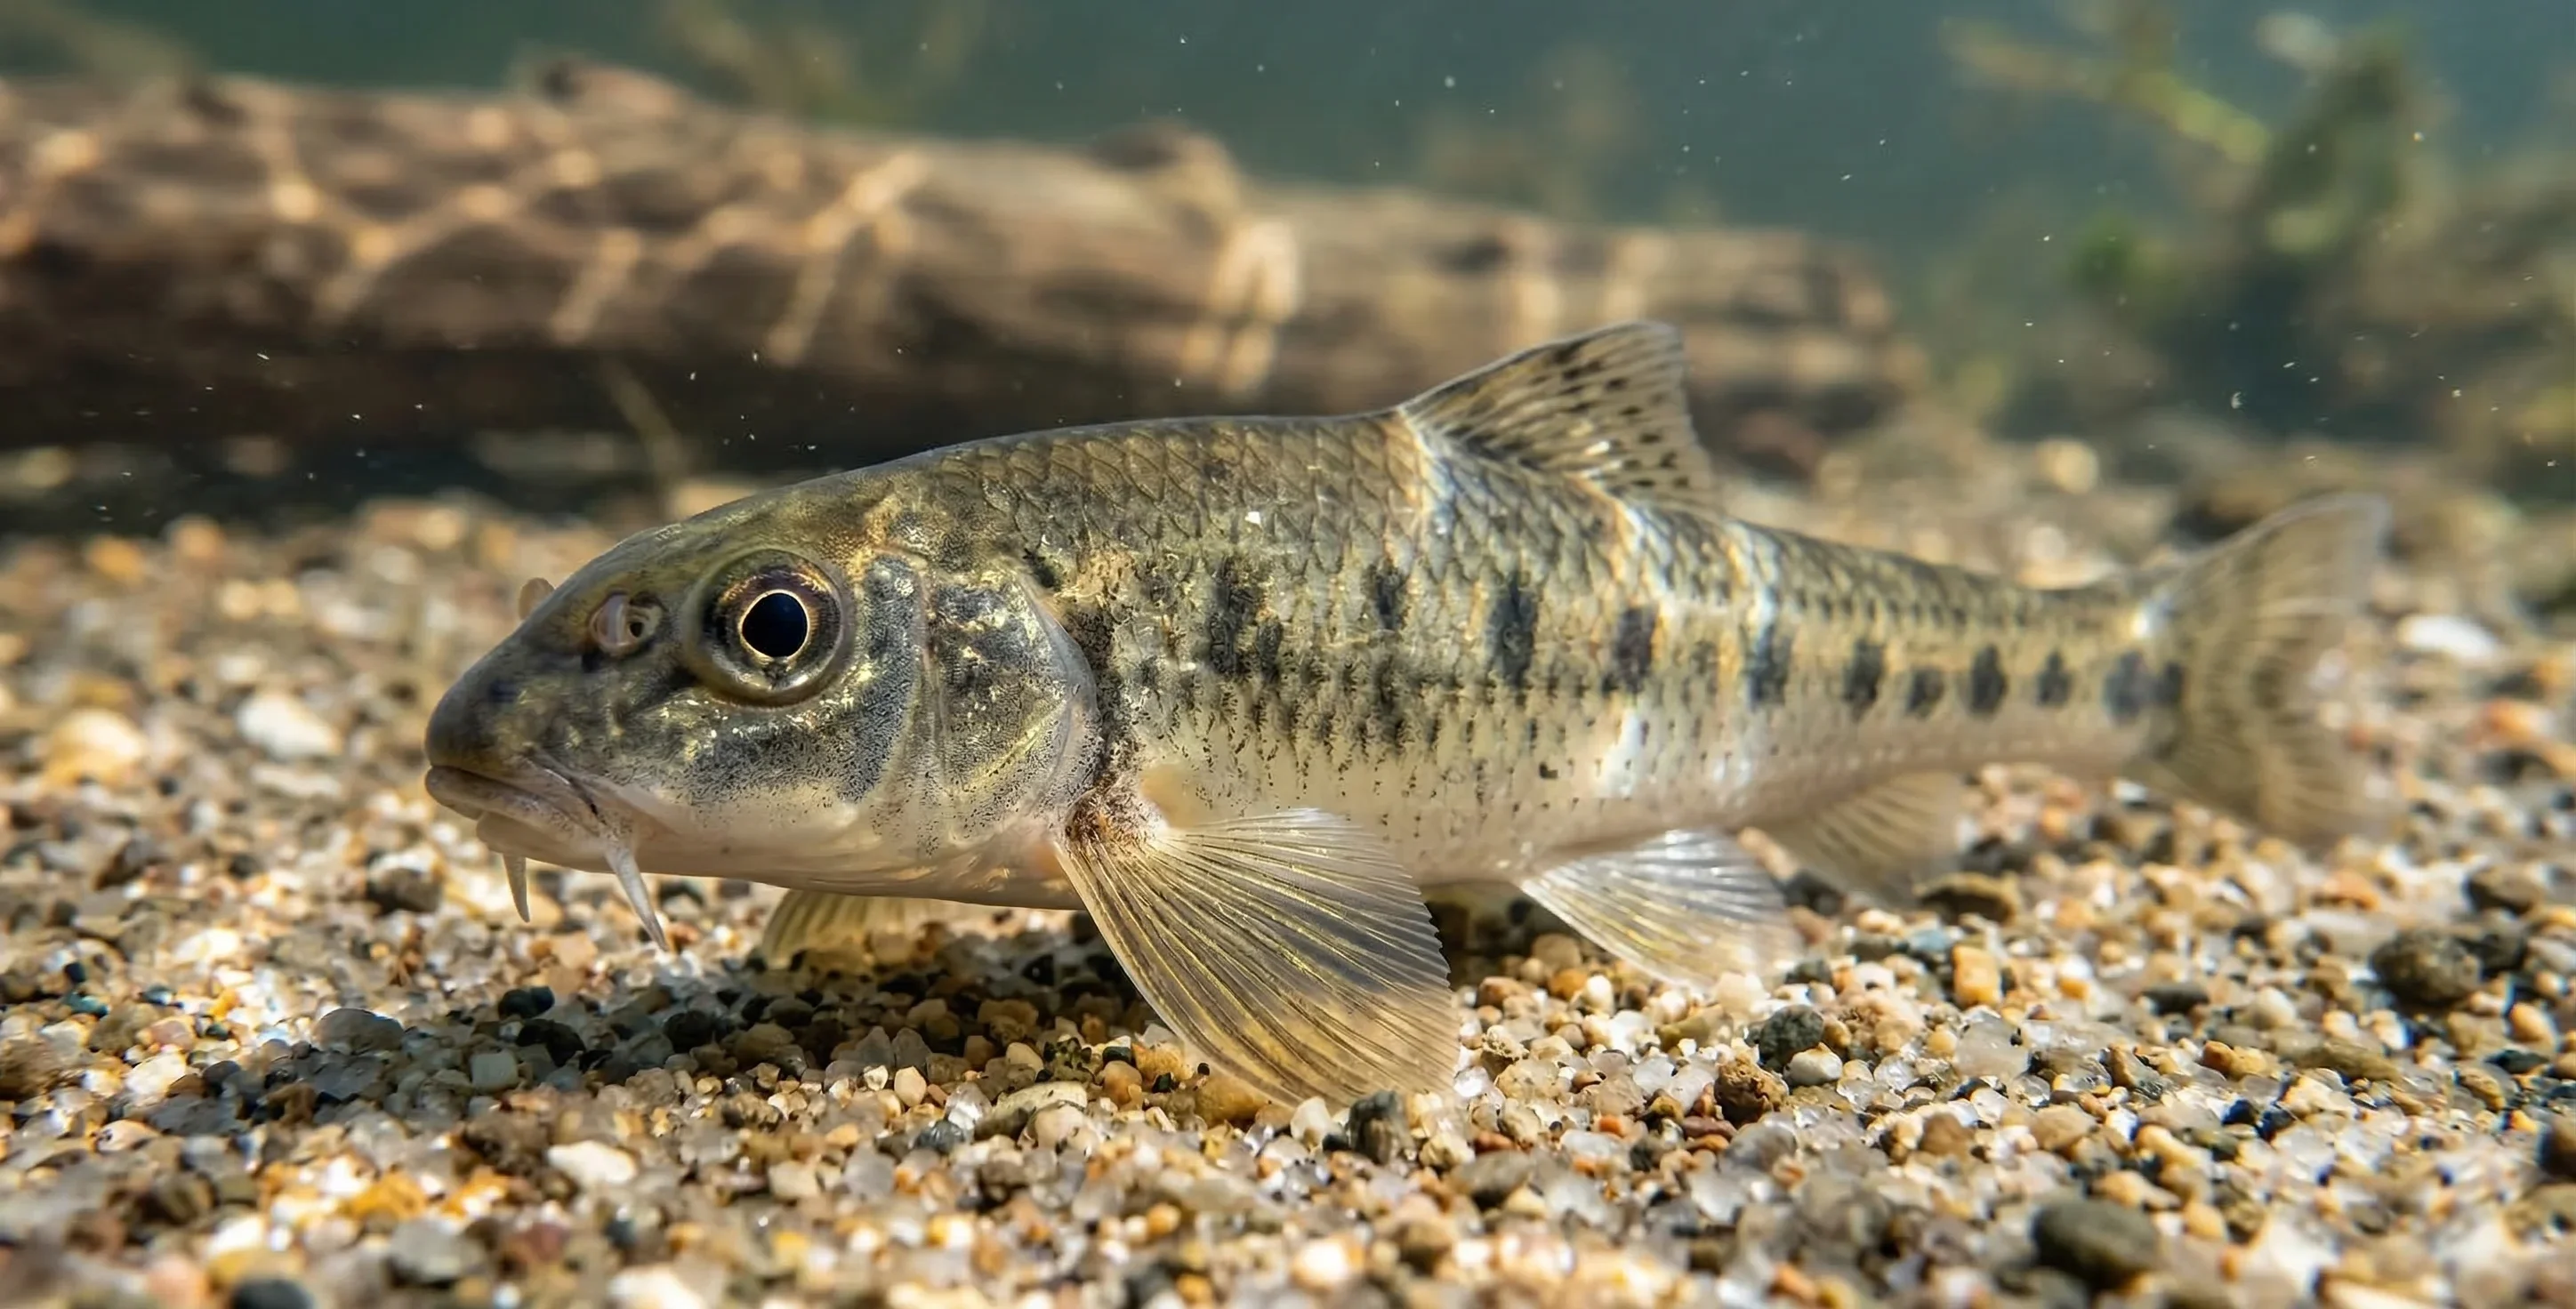 Gudgeon
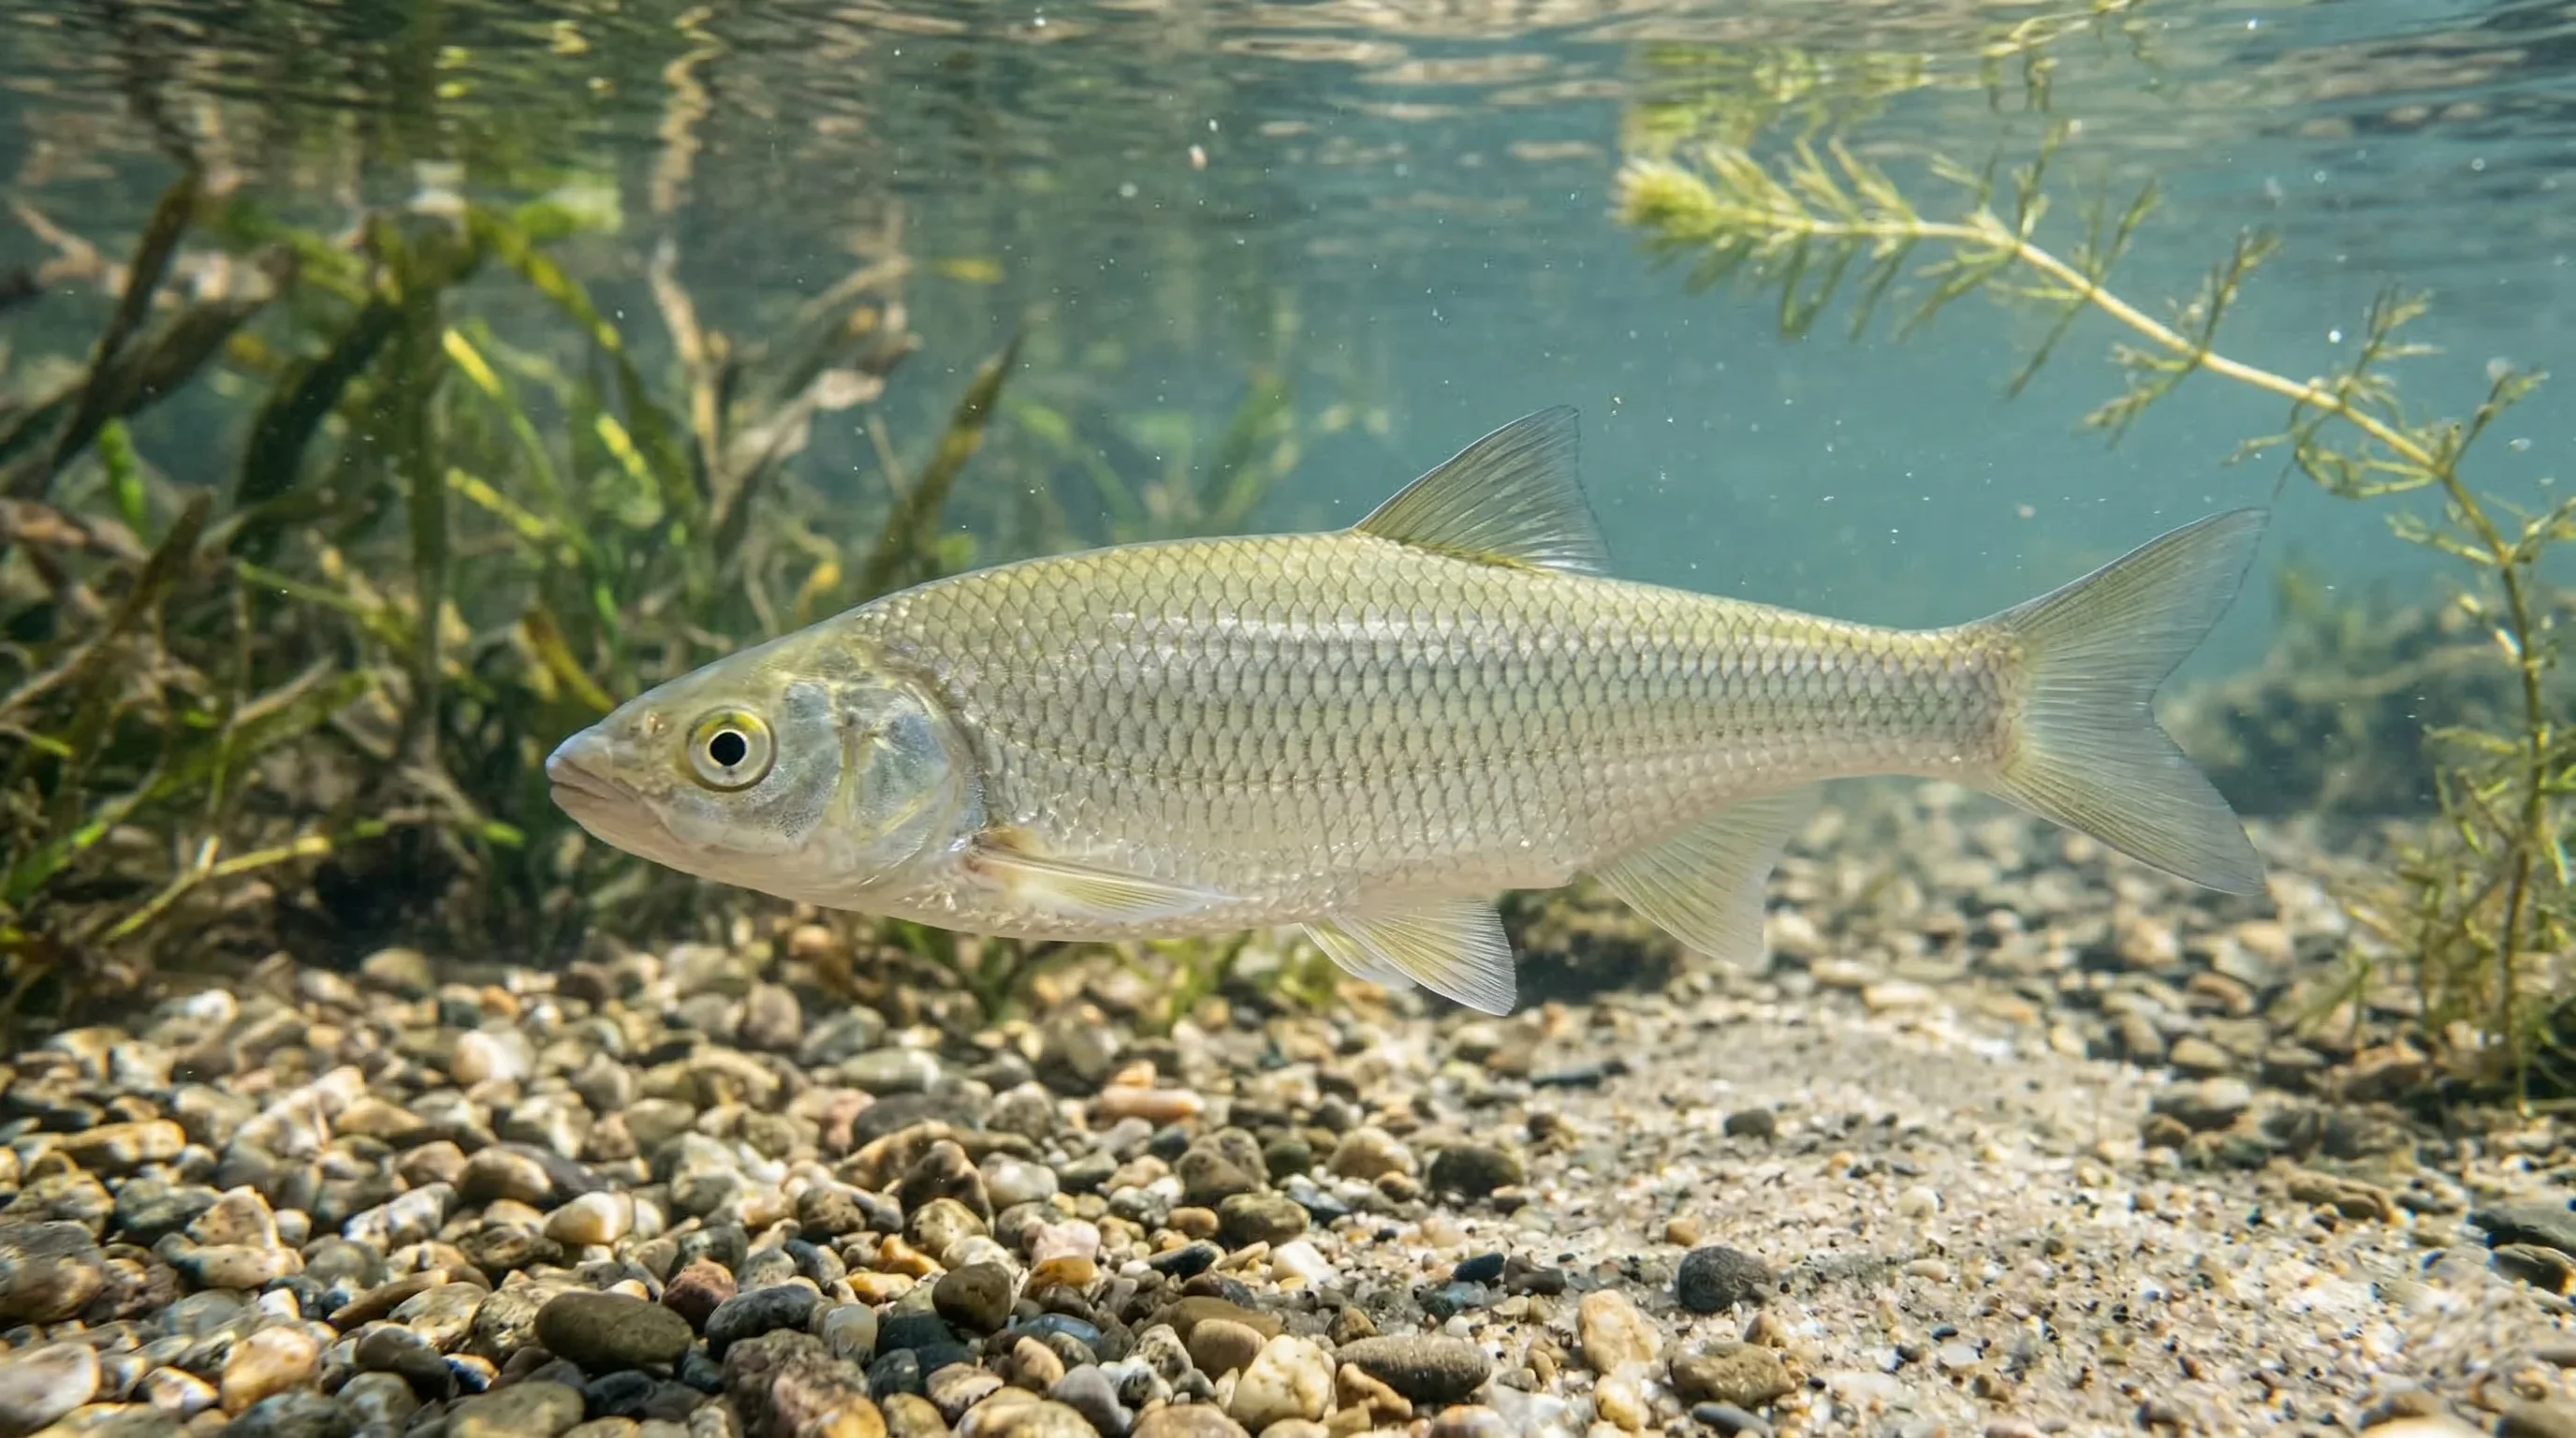 Common Dace
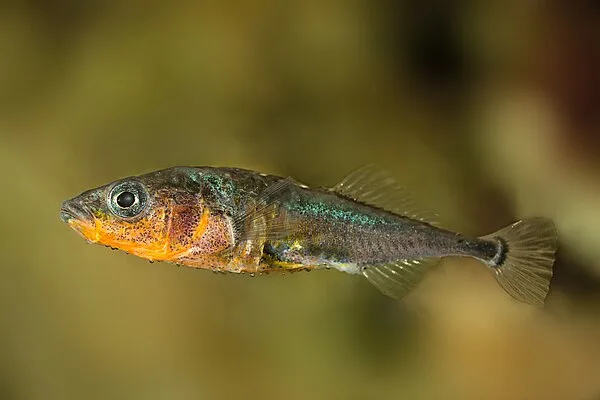 Stickleback
Apex Predators
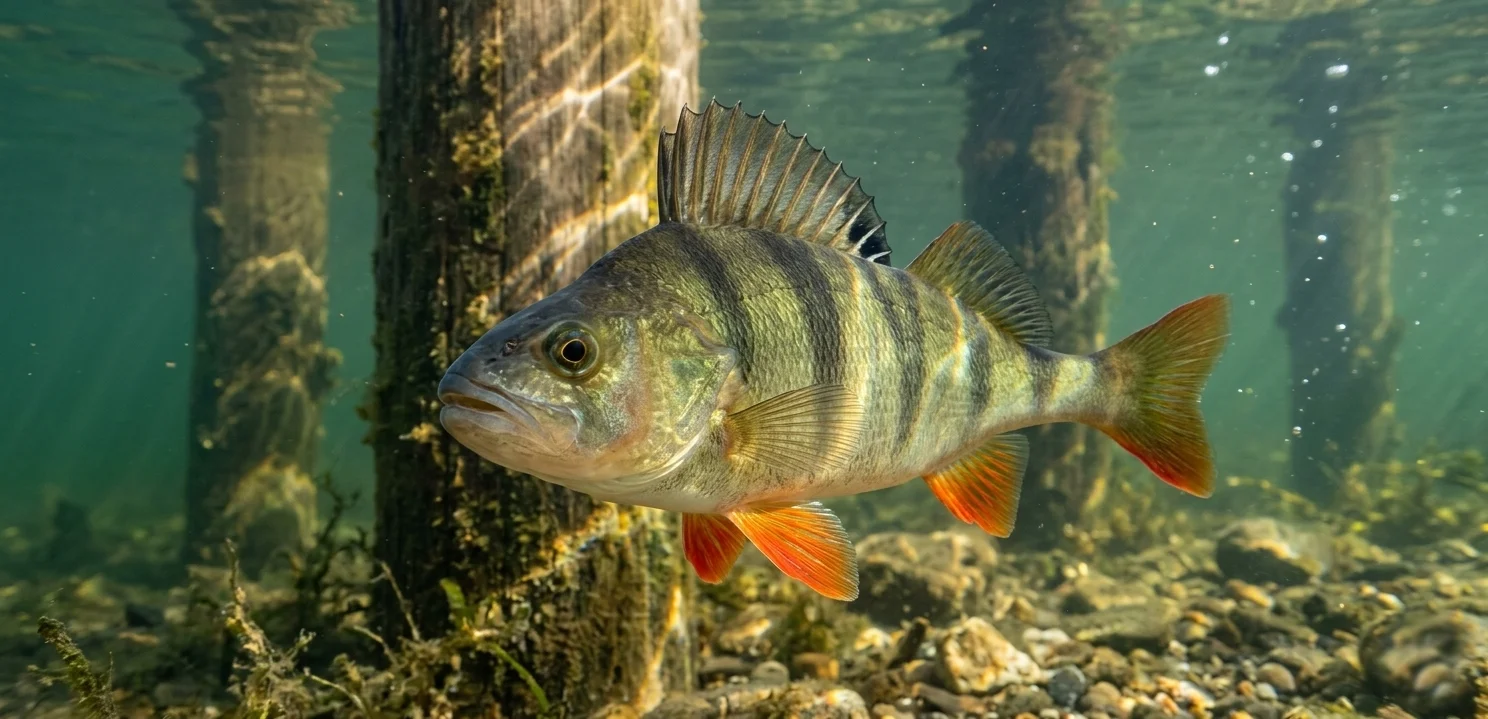 Perch
Perch
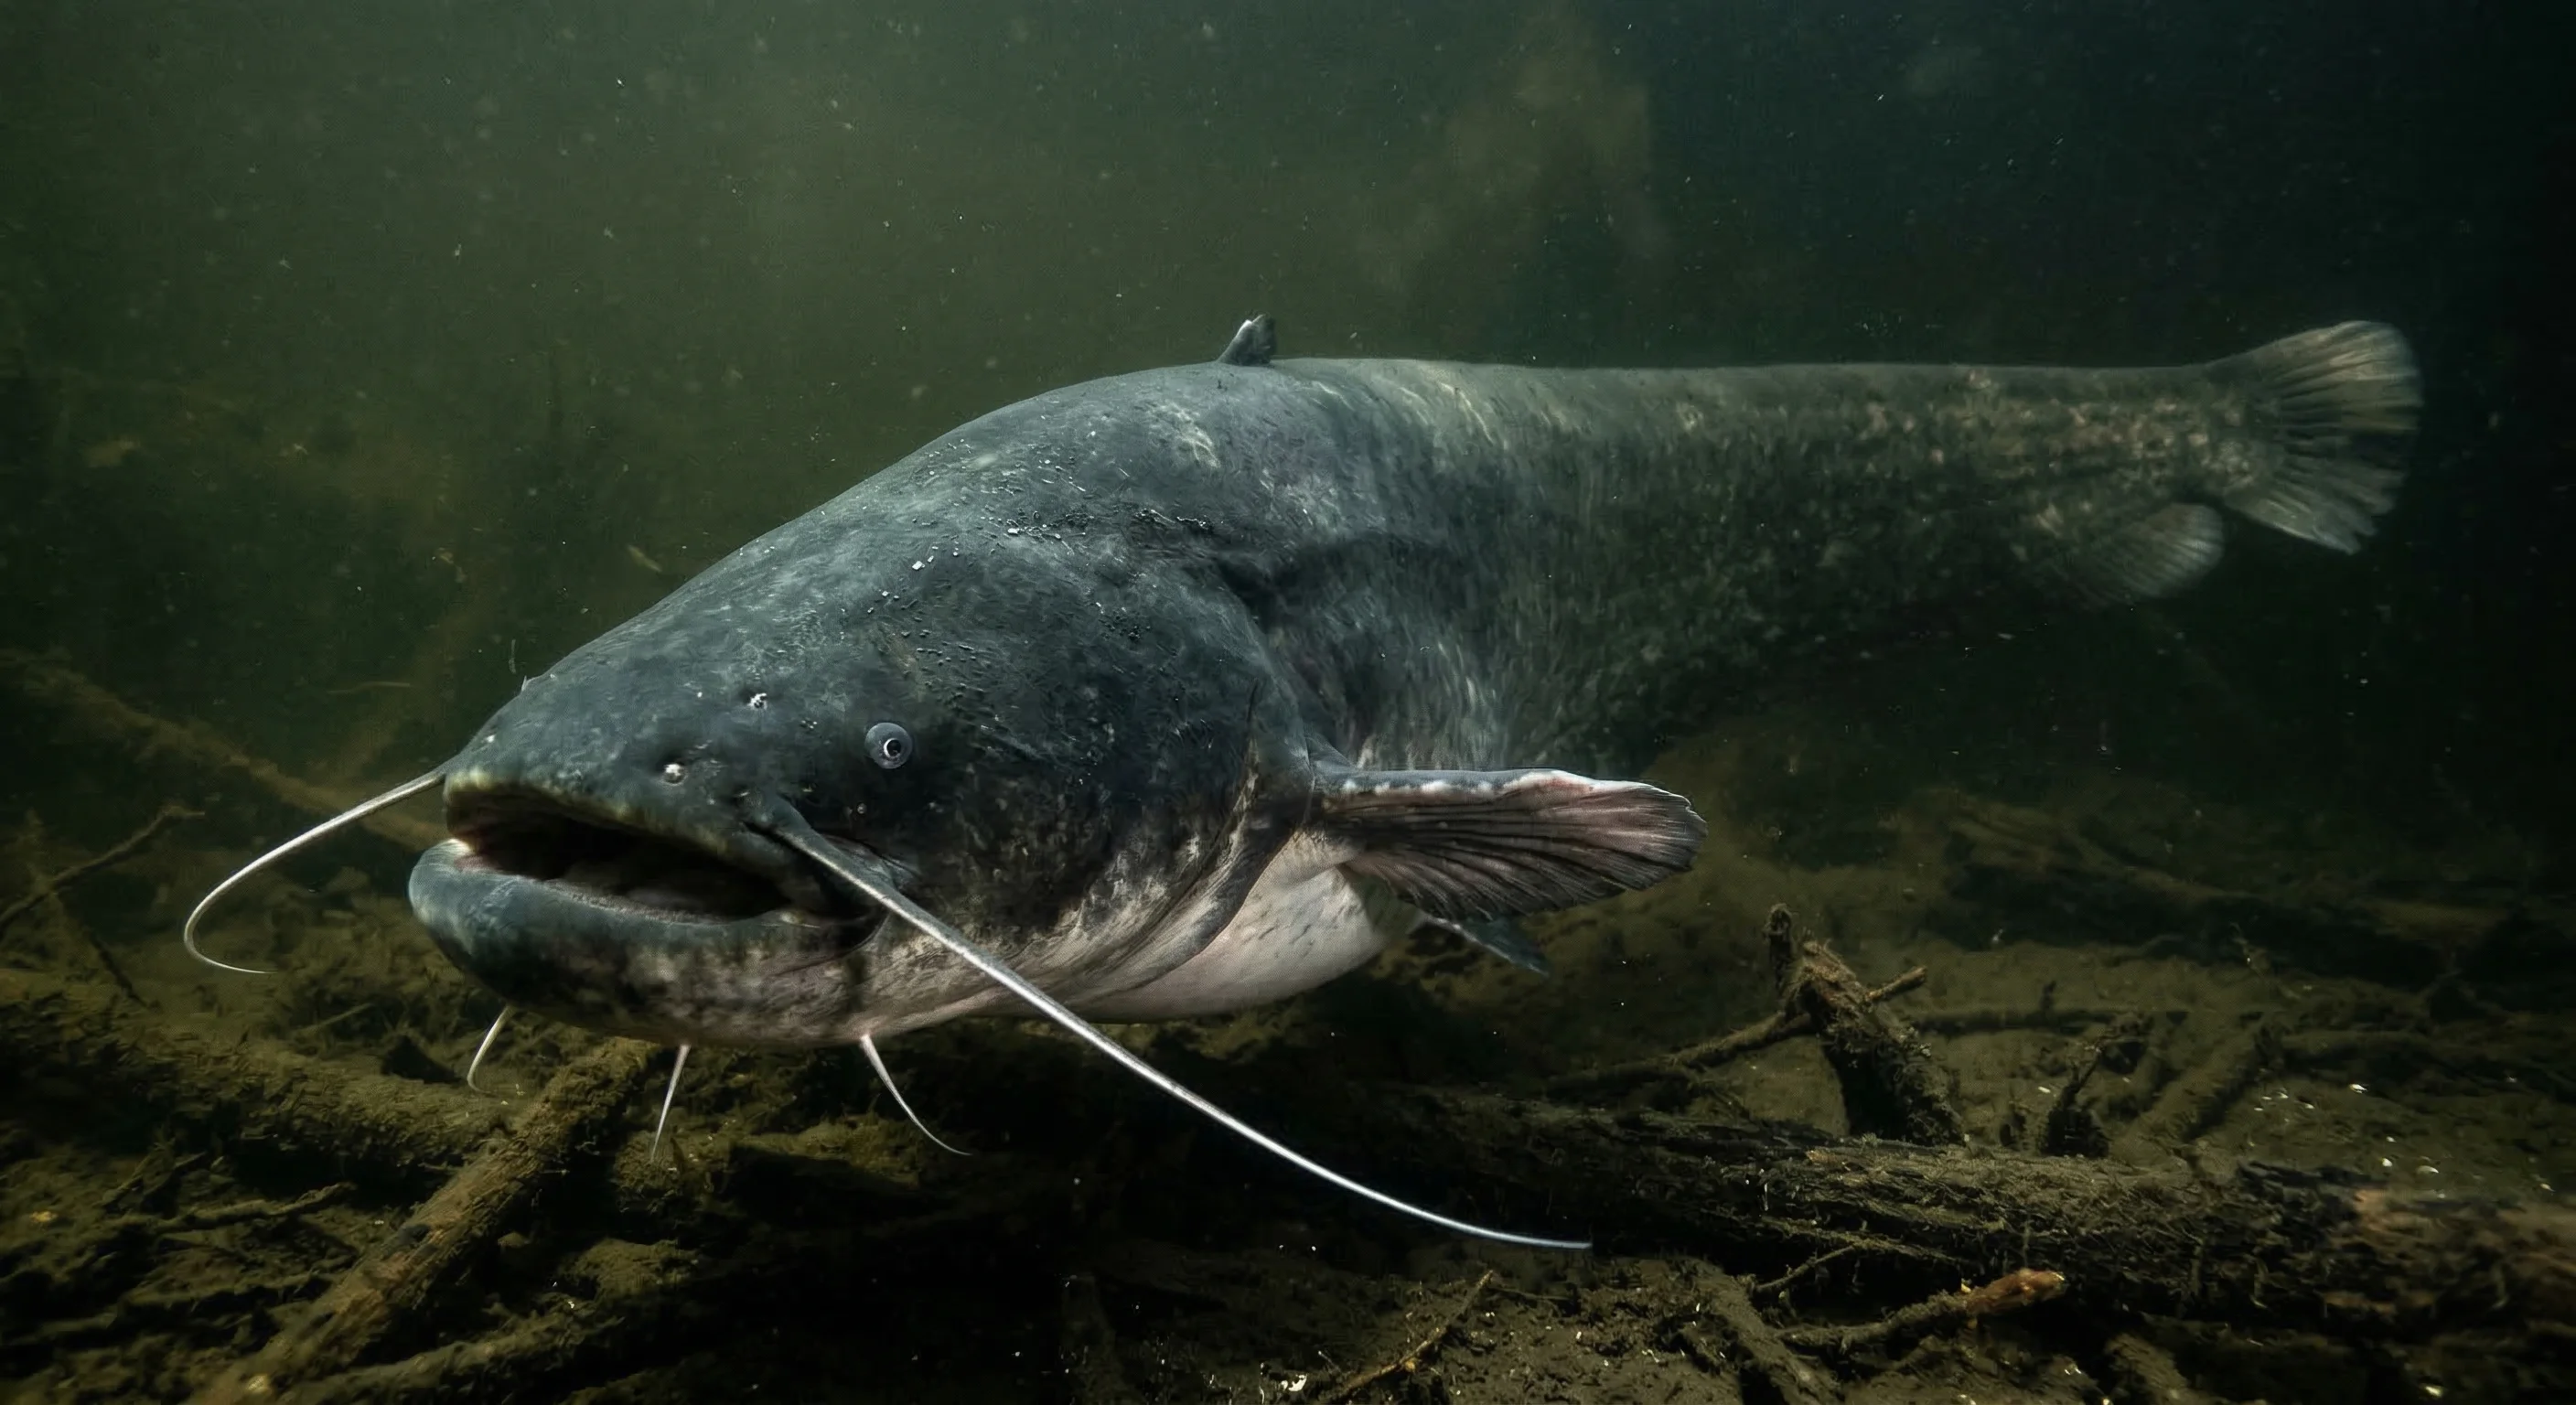 Catfish
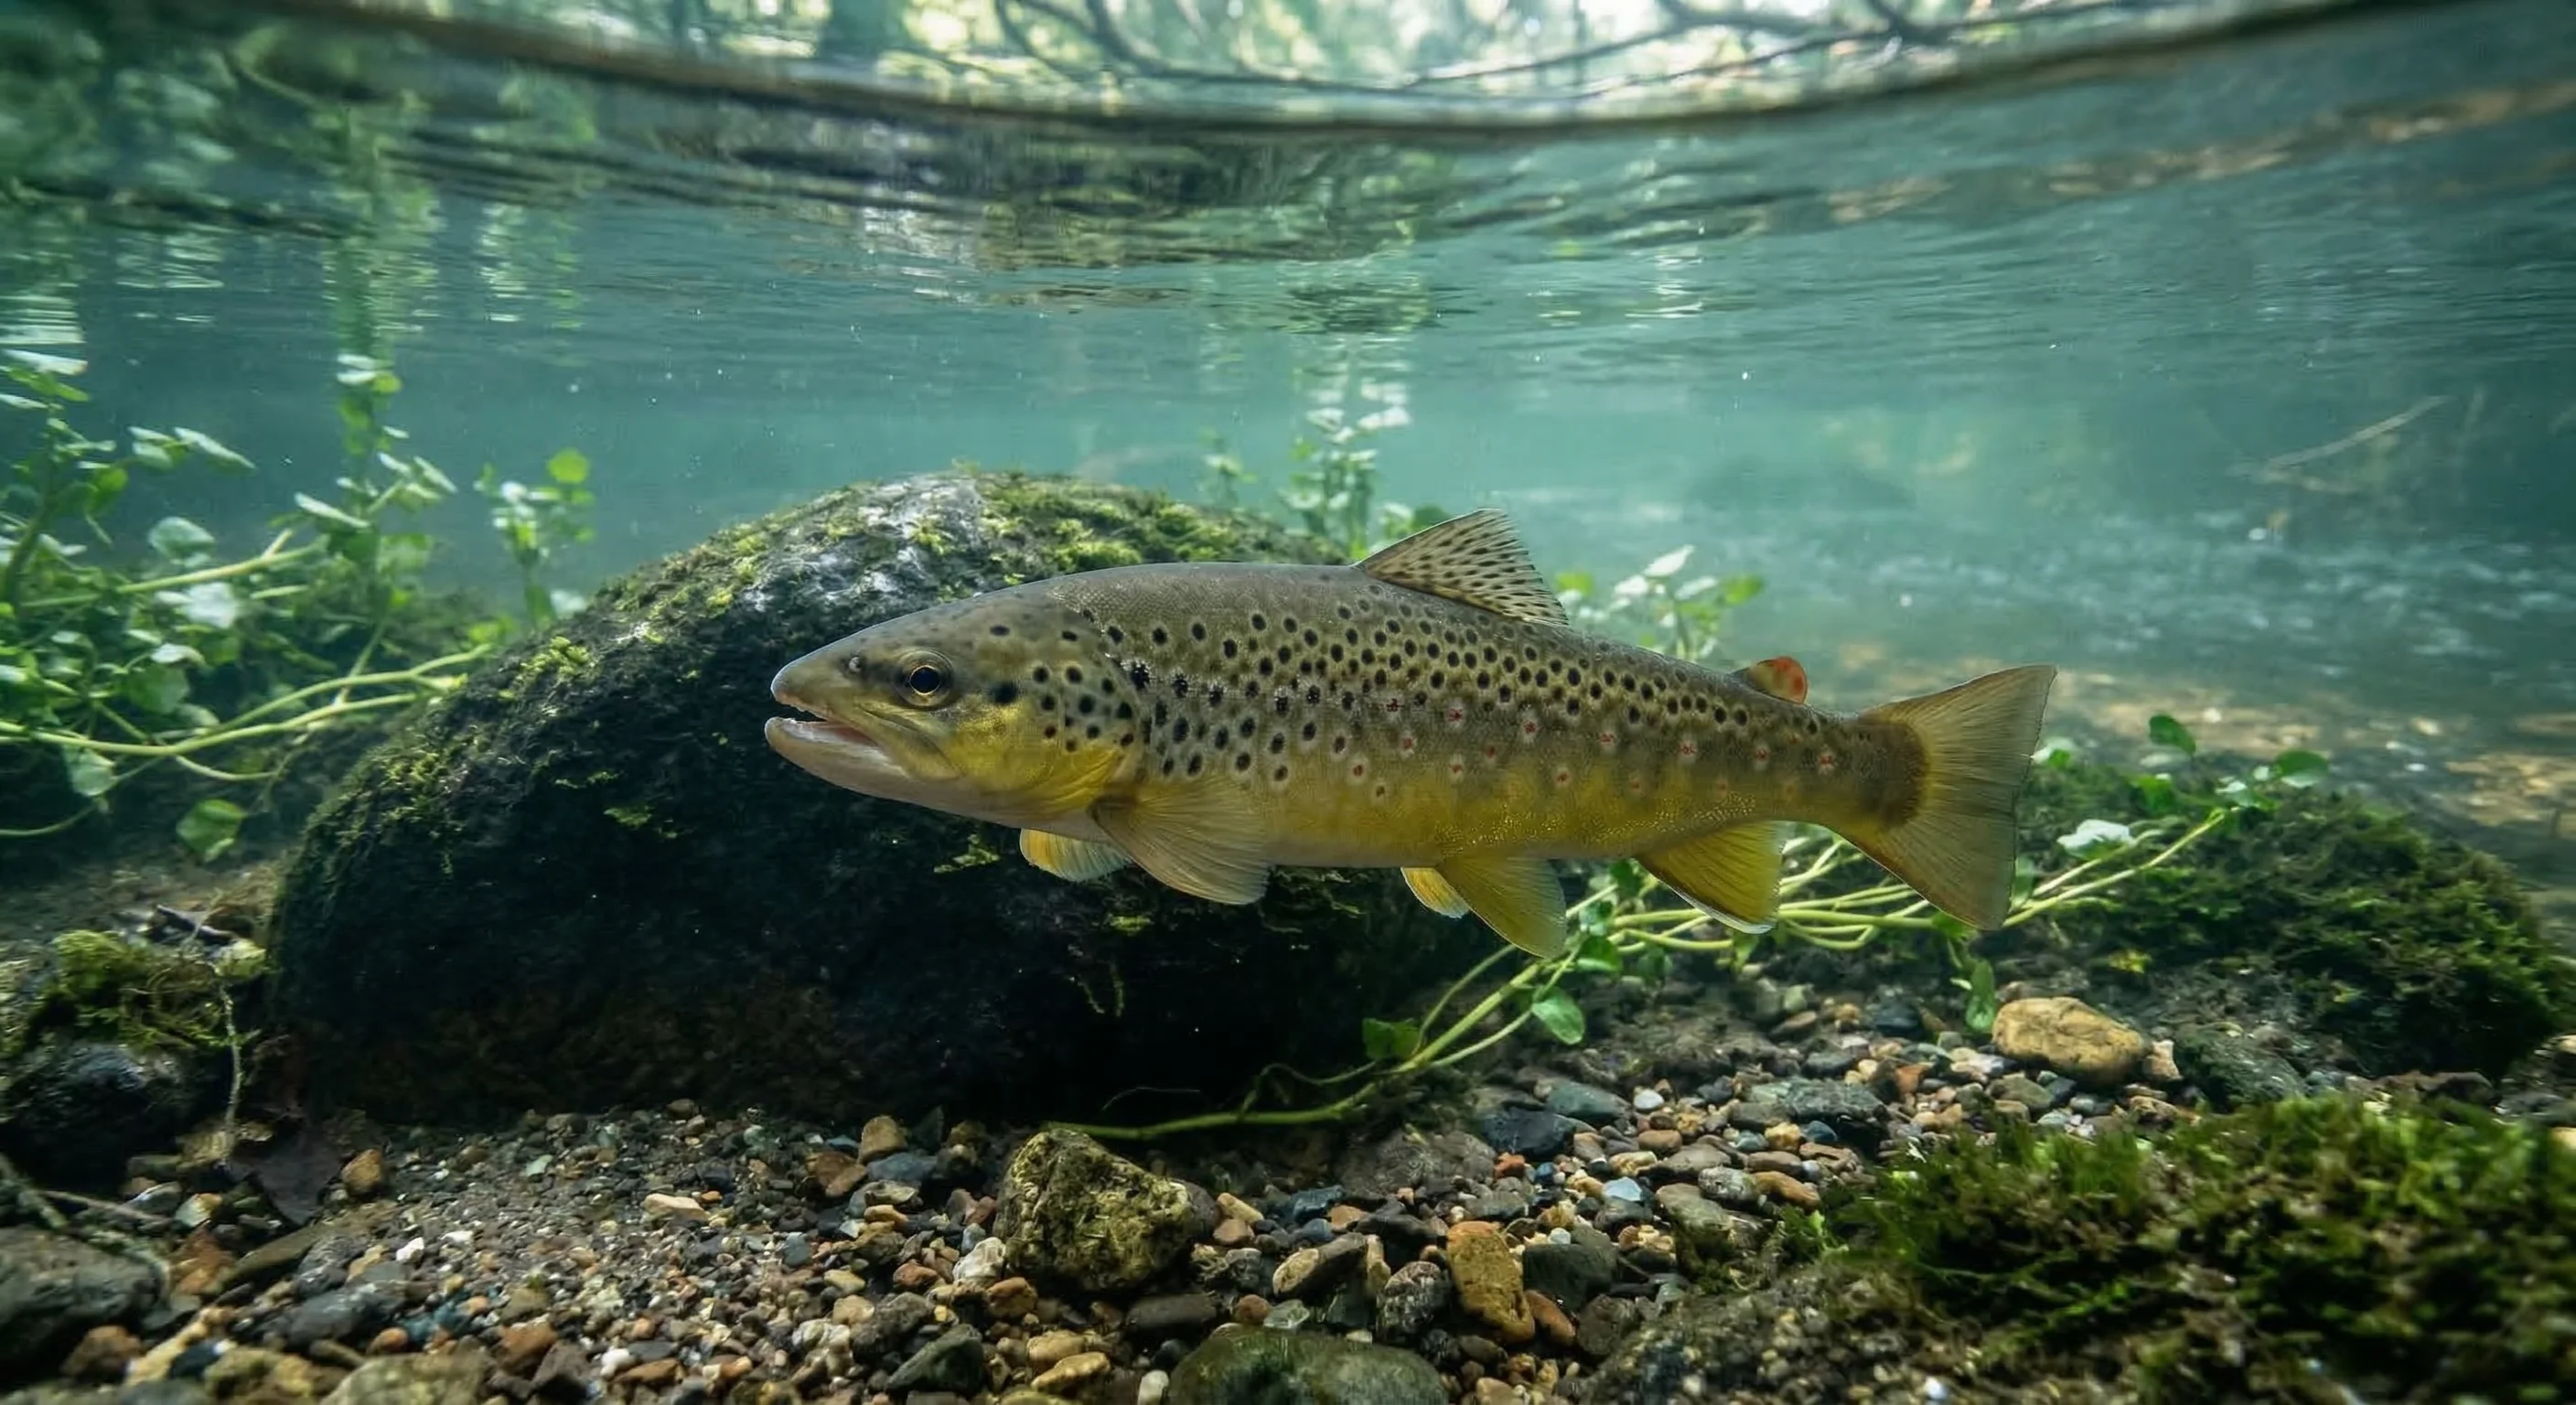 Brown Trout
We track every organism family from phytoplankton to apex predators. When prey populations shift, the system detects the ripple effect on fish catches.