Skip to content
The Lab

Development

Every release, logged — newest at the top.

v1.1

Lakes & Depth Maps

Current July 2026

Every named Dutch lake gets its own page — with all organisms, rarity, a depth map and the sharpest aerial imagery. Plus a 48-hour hourly forecast that shows, per species, when the fish bite, and a spot analysis that honestly shows how over-represented each organism is at a location.
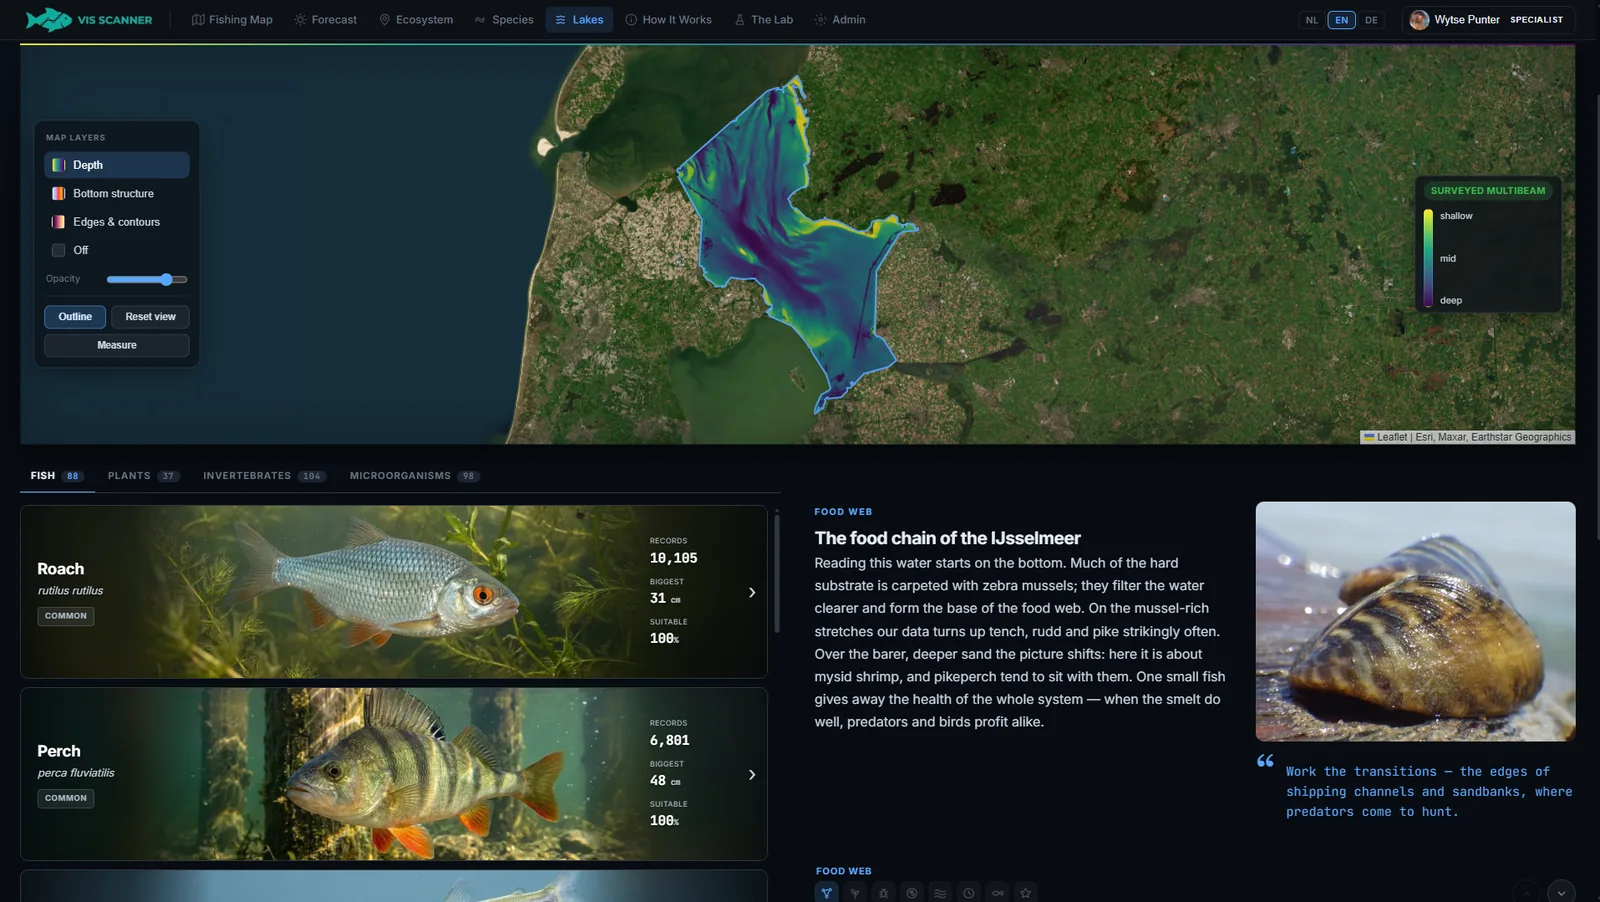
Every named lake its own page: species, water quality and the food web of that specific water.
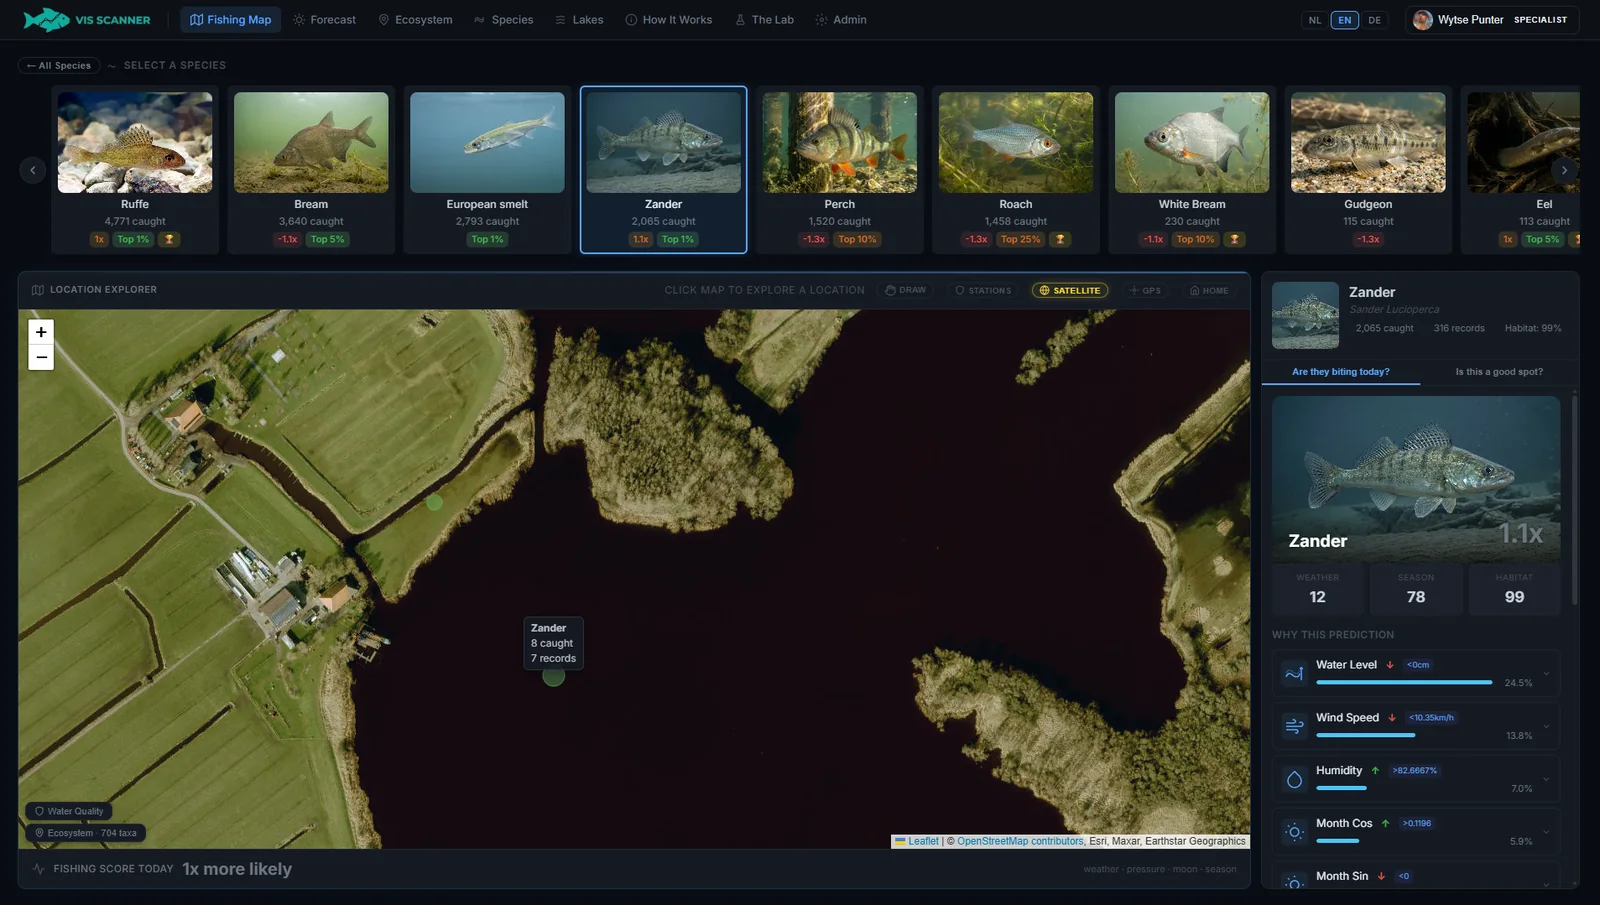
Aerial imagery as a map layer — zoom right in on any bank, sharper than the standard map. Explorer
Aerial imagery as a map layer — zoom right in on any bank, sharper than the standard map.
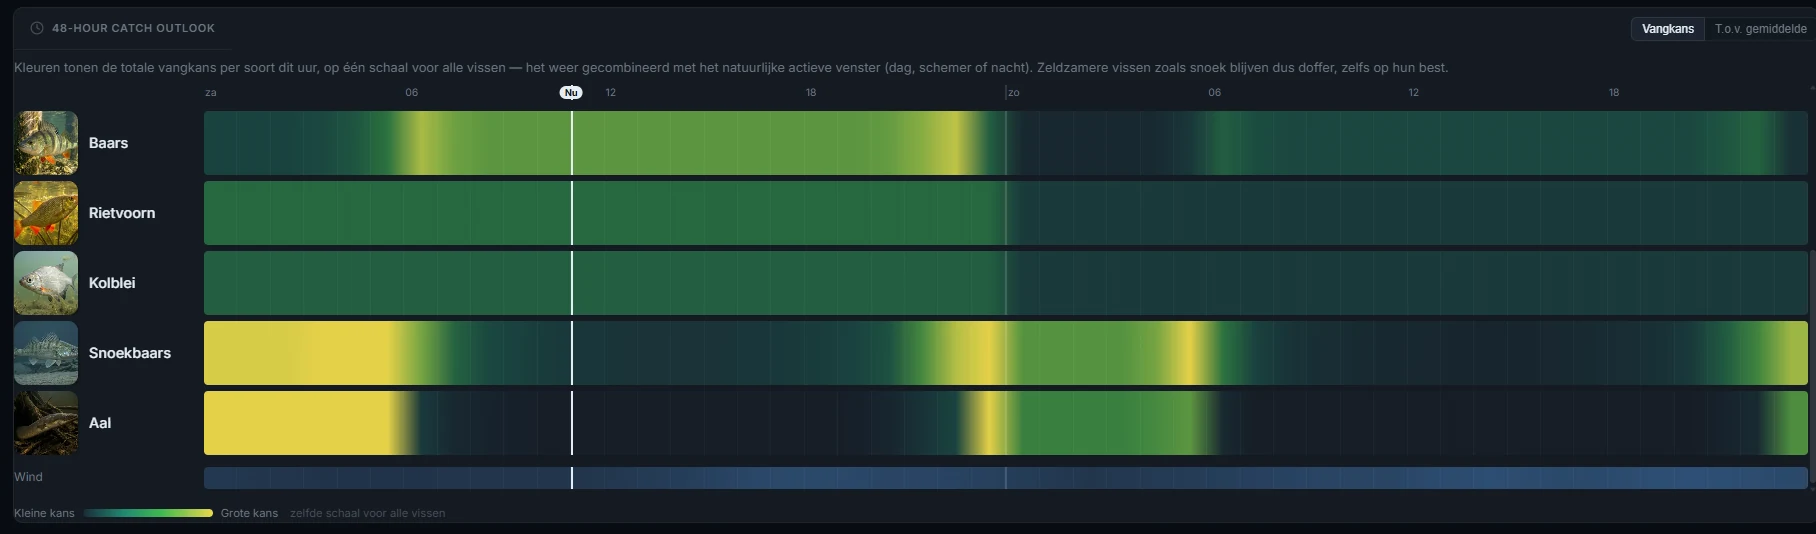
48-hour catch outlook per species — colour shows the hourly chance, weather combined with each species' active window (day, dusk, night). Pikeperch and eel light up at night. Explorer
48-hour catch outlook per species — colour shows the hourly chance, weather combined with each species' active window (day, dusk, night). Pikeperch and eel light up at night.
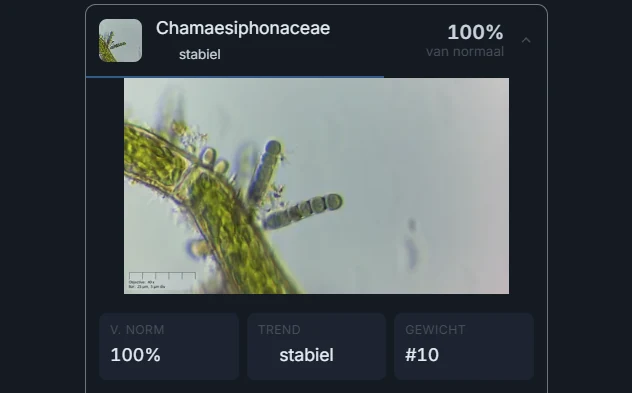
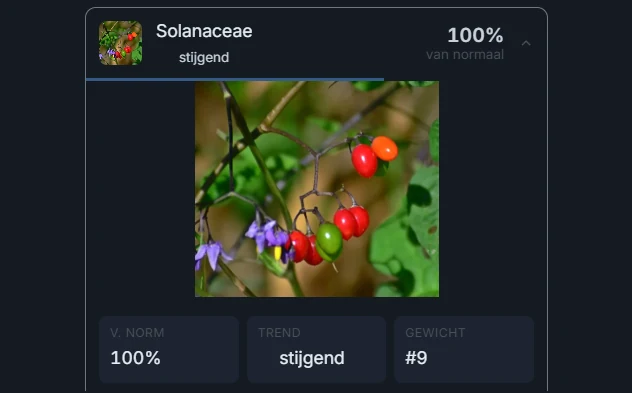
In 'why this is a good spot', every organism factor shows how over-represented it is here — as a percentage of a typical water (100% = normal), corrected for how much each spot was surveyed.
Expanded, you see the strength, the trend over time and the model weight side by side — spatial and temporal signal kept cleanly apart.

Lake pages

  • A dedicated page per named lake, with map, fish species, water quality and the food web of that specific water.
  • Every recorded organism per lake — fish, aquatic plants, insects, molluscs — not just the familiar target species.
  • Rarity classification on every species and organism card, based on how often something is recorded nationally.

Depth maps & structure

  • Per-lake depth maps wherever reliable bathymetry exists, labelled 'surveyed' or 'modelled'.
  • Structure layers that reveal drop-offs, channel edges and shallows — the places fish hold.

Satellite imagery

  • The sharpest aerial imagery available as a map layer, served same-origin so it loads everywhere.

Hourly forecast

  • 48-hour hourly forecast per species (Explorer and up): a heatmap showing how promising each fish is by the hour — weather combined with the species' natural active window (day, dusk or night).
  • So you can watch pikeperch and eel peak at different hours — the temporal patterns from our moon research, now readable hour by hour.

Spot analysis

  • In 'why this is a good spot', every organism factor now shows how strongly it is over-represented here — as a percentage of a typical water (100% = normal), corrected for how much each spot was surveyed.
  • Strength, the trend over time and the model weight are shown separately, so spatial and temporal signal don't blur together. Worded neutrally: co-occurrence points to suitable habitat — more is not automatically better.

Under the hood

  • A food-web story per lake, generated from that water's own co-occurrence signal rather than boilerplate text.
  • Expanded structured data and hreflang (NL/EN/DE); all lake pages added to the sitemap.
v1.0

First Cast

Released March 2026

VisScanner went live: a data-driven fishing map for the whole of the Netherlands, built on open data and models validated on unseen data.

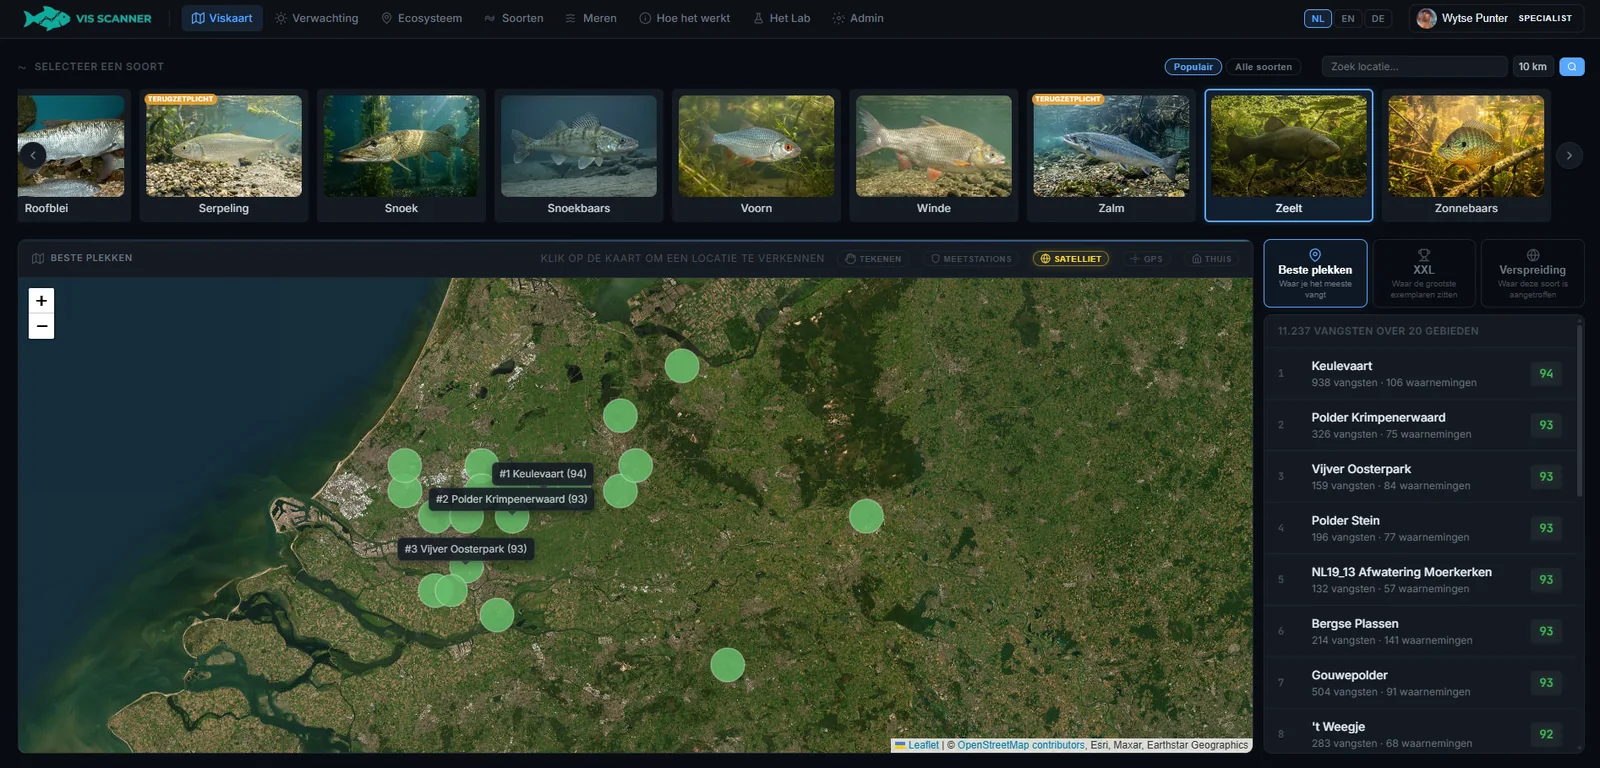
The best spots per species, ranked by where you catch the most — nationwide, from canal to city pond. Explorer
The best spots per species, ranked by where you catch the most — nationwide, from canal to city pond.
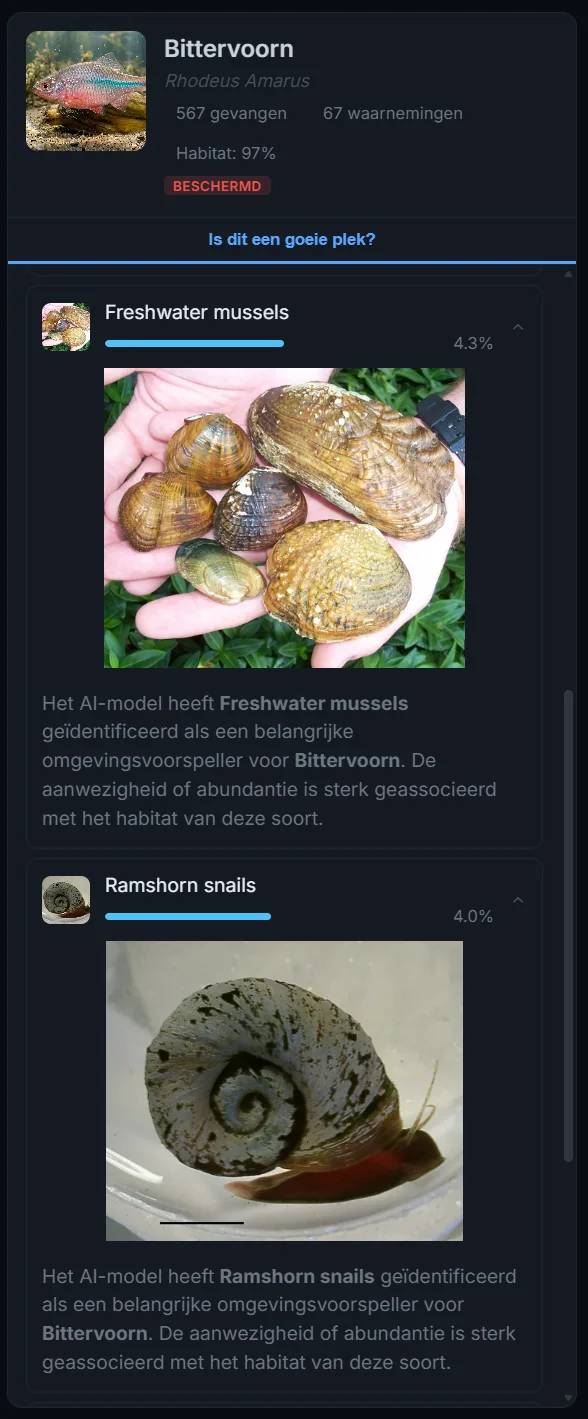
Why a spot is suitable: the per-species habitat score, plus the organisms that predict the habitat. Explorer
Why a spot is suitable: the per-species habitat score, plus the organisms that predict the habitat.
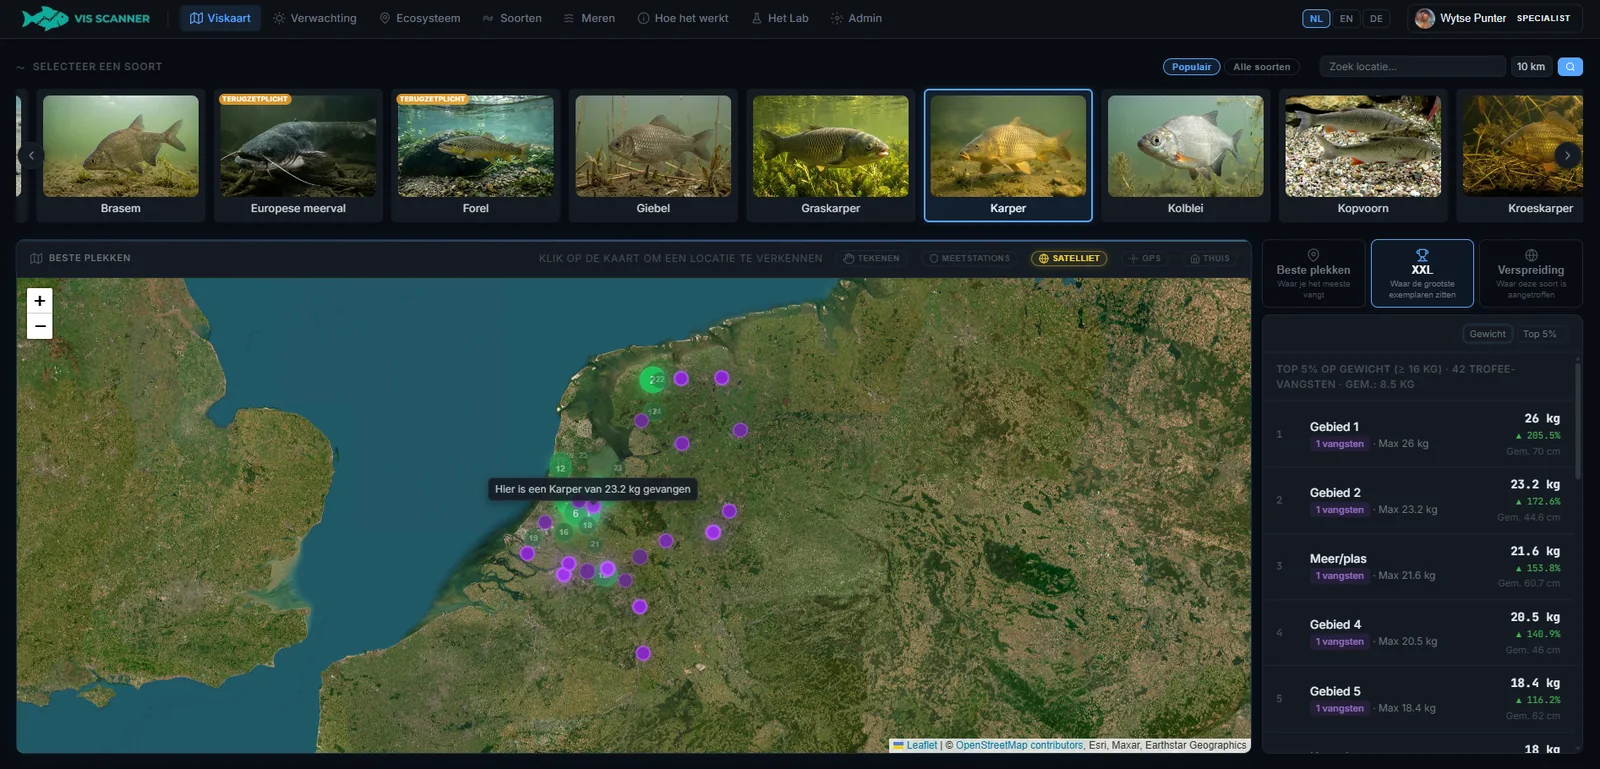
Trophy spots: where a species grows larger than average. Specialist
Trophy spots: where a species grows larger than average.
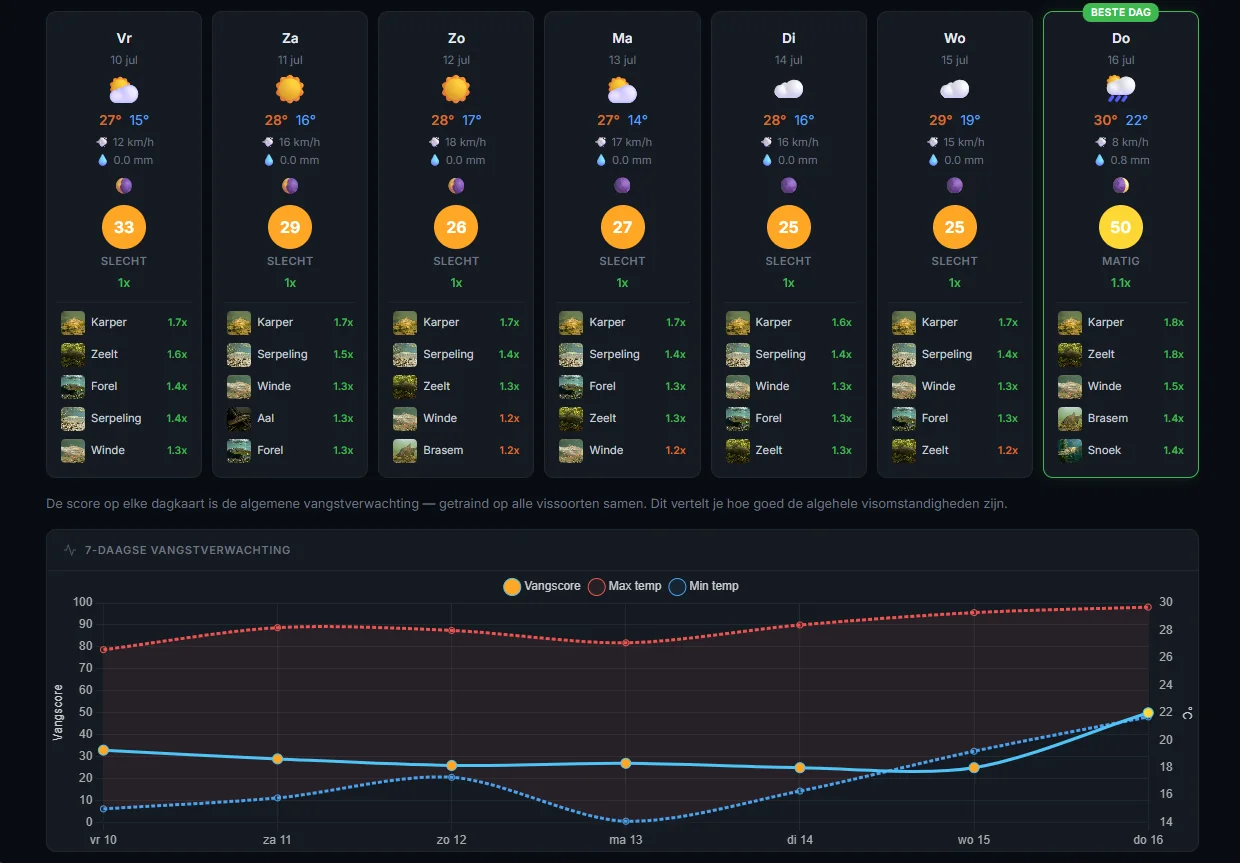
7-day forecast: which day — and which species — gives you the best odds. Explorer
7-day forecast: which day — and which species — gives you the best odds.
The models
Catch model gradient boosting

Predicts how promising a day is from weather, water level, wind and season. Trained across all species and the engine behind the 7-day forecast. The data itself showed water level and wind dominate — not the moon.

Habitat model gradient boosting · trained per species

Estimates per grid cell how suitable the habitat is for a species, from water quality, prey and surroundings. Each model is validated on cells it has never seen (ROC-AUC).

Spot model precomputed

Ranks the best spots per species by combining catch data and habitat scores. Computed nightly so the map stays instant.

Size model random forest · trained per species

Predicts where a species grows larger than average — the trophy spots — from length measurements and the local conditions that drive growth.

The map

  • Interactive fishing map with the best spots based on catch data and habitat models.
  • Trophy spots and catch hotspots per species.

Species

  • Species pages with season, regulations, distribution and statistics for over 250 species.

Prediction

  • 7-day fishing forecast based on weather forecasts, fed by the general catch model.

Ecosystem & water

  • Ecosystem explorer with Shannon diversity, sampling coverage and cyanobacteria risk.
  • Water quality (Rijkswaterstaat), weather (KNMI/Open-Meteo) and biodiversity (GBIF).

Platform

  • Three languages (Dutch, English, German) and subscription tiers (Free, Explorer, Specialist).