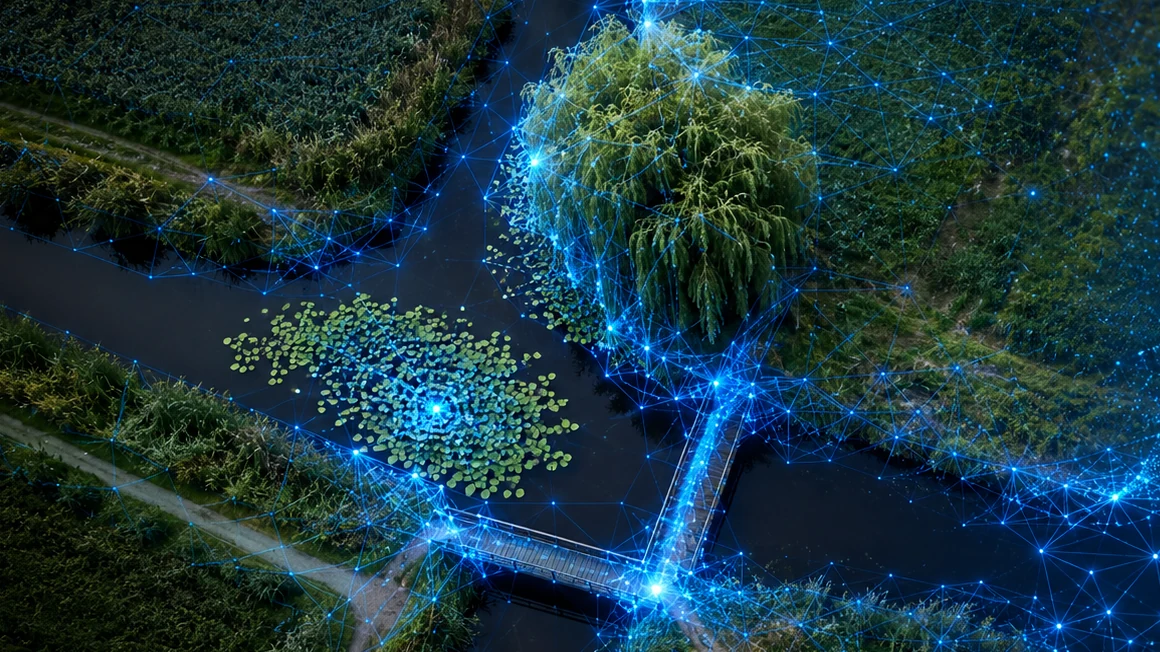
Every catch record is a point on the map — precise, but sparse: nobody surveys every overhanging willow. And it's exactly those metres an angler thinks in: that one willow, the T-junction in the canal, the reed edge, the fallen tree. Can you learn that fine structure from aerial photos — everywhere, not just where someone happened to sample — and tie it to which fish are there?
First, the dead end
The obvious approach: hand-label a few hundred examples — fallen tree, lily pad, reed edge, bridge, T-junction — and train a classifier on them. We built the labelling tool and got started. Then the penny dropped: by choosing the classes yourself, you cap the model. It can never find anything we hadn't already thought of. And there are probably hundreds of visual patterns that distinguish Dutch waters — water colour, bank material, urban versus rural, algal tint — that we'd never name by hand.
Letting the model discover for itself
So we turned it around. We cut aerial photos into small patches and run them through DINOv2 — an open vision model from Meta that learns, without labels, what makes images differ. No prescribed classes; the model builds its own map of visual patterns. Then we cluster those patterns, and here's the trick we call the catch referee: the catch data itself decides which clusters matter. For each cluster we look at which fish species occur in those grid cells more often than average.
What we label by hand — and why we keep at it
Self-supervised learning finds the patterns; to name them and test them per species, we still label by hand — but now with intent. Bridges, fallen trees, T-junctions, lily beds, small islands. For each we ask: which species does this structure attract, and which does it repel?
Some signals are strong and consistent. Lily beds are positive for tench, but negative for pikeperch — and that is ecologically exactly right. Others are far more erratic. And that erraticness is why this chapter isn't finished.
The bridge paradox — and why we don't publish it
Take bridges. Our hand-labelled analysis said: bridges hold below-average fish — negative for carp, bream, pike, perch and pikeperch. A seemingly tidy conclusion: 'fish avoid bridges.' But at the same time our imagery model kept flagging bridges as promising. Two analyses on the same data, opposite answers.
So we don't push 'fish avoid bridges' out as a headline. First we correct for accessibility; only what remains after that is the real fish signal. That's exactly the kind of work you never see in the finished product — and exactly why you can trust the conclusions we do publish.
What else lies underneath
Along the way we learned a few more things. The choice of vision model matters: a backbone trained on aerial imagery beats DINOv2 on the finest features — domain knowledge wins. And shape turns out to be surprisingly predictive: cluster every Dutch water by its geometry alone and a 'fingerprint' appears. The stone loach, for instance, lives distinctly in small round ponds and distinctly not in long canals — the same little fish, opposite signal, purely from the shape of the water.
Why this isn't live yet
This is deliberately not yet a button in the app. We want to separate the signals that are real from the signals that are bias, and that's exactly the step most people skip. Our rule is the same as for the models — the refutation gate: it only ships once we can no longer knock down our own conclusion. For overhanging trees and carp, we're nearly there. For bridges, nowhere near.
Status: ongoing. We publish per finding, not per promise.
Updated: July 9, 2026