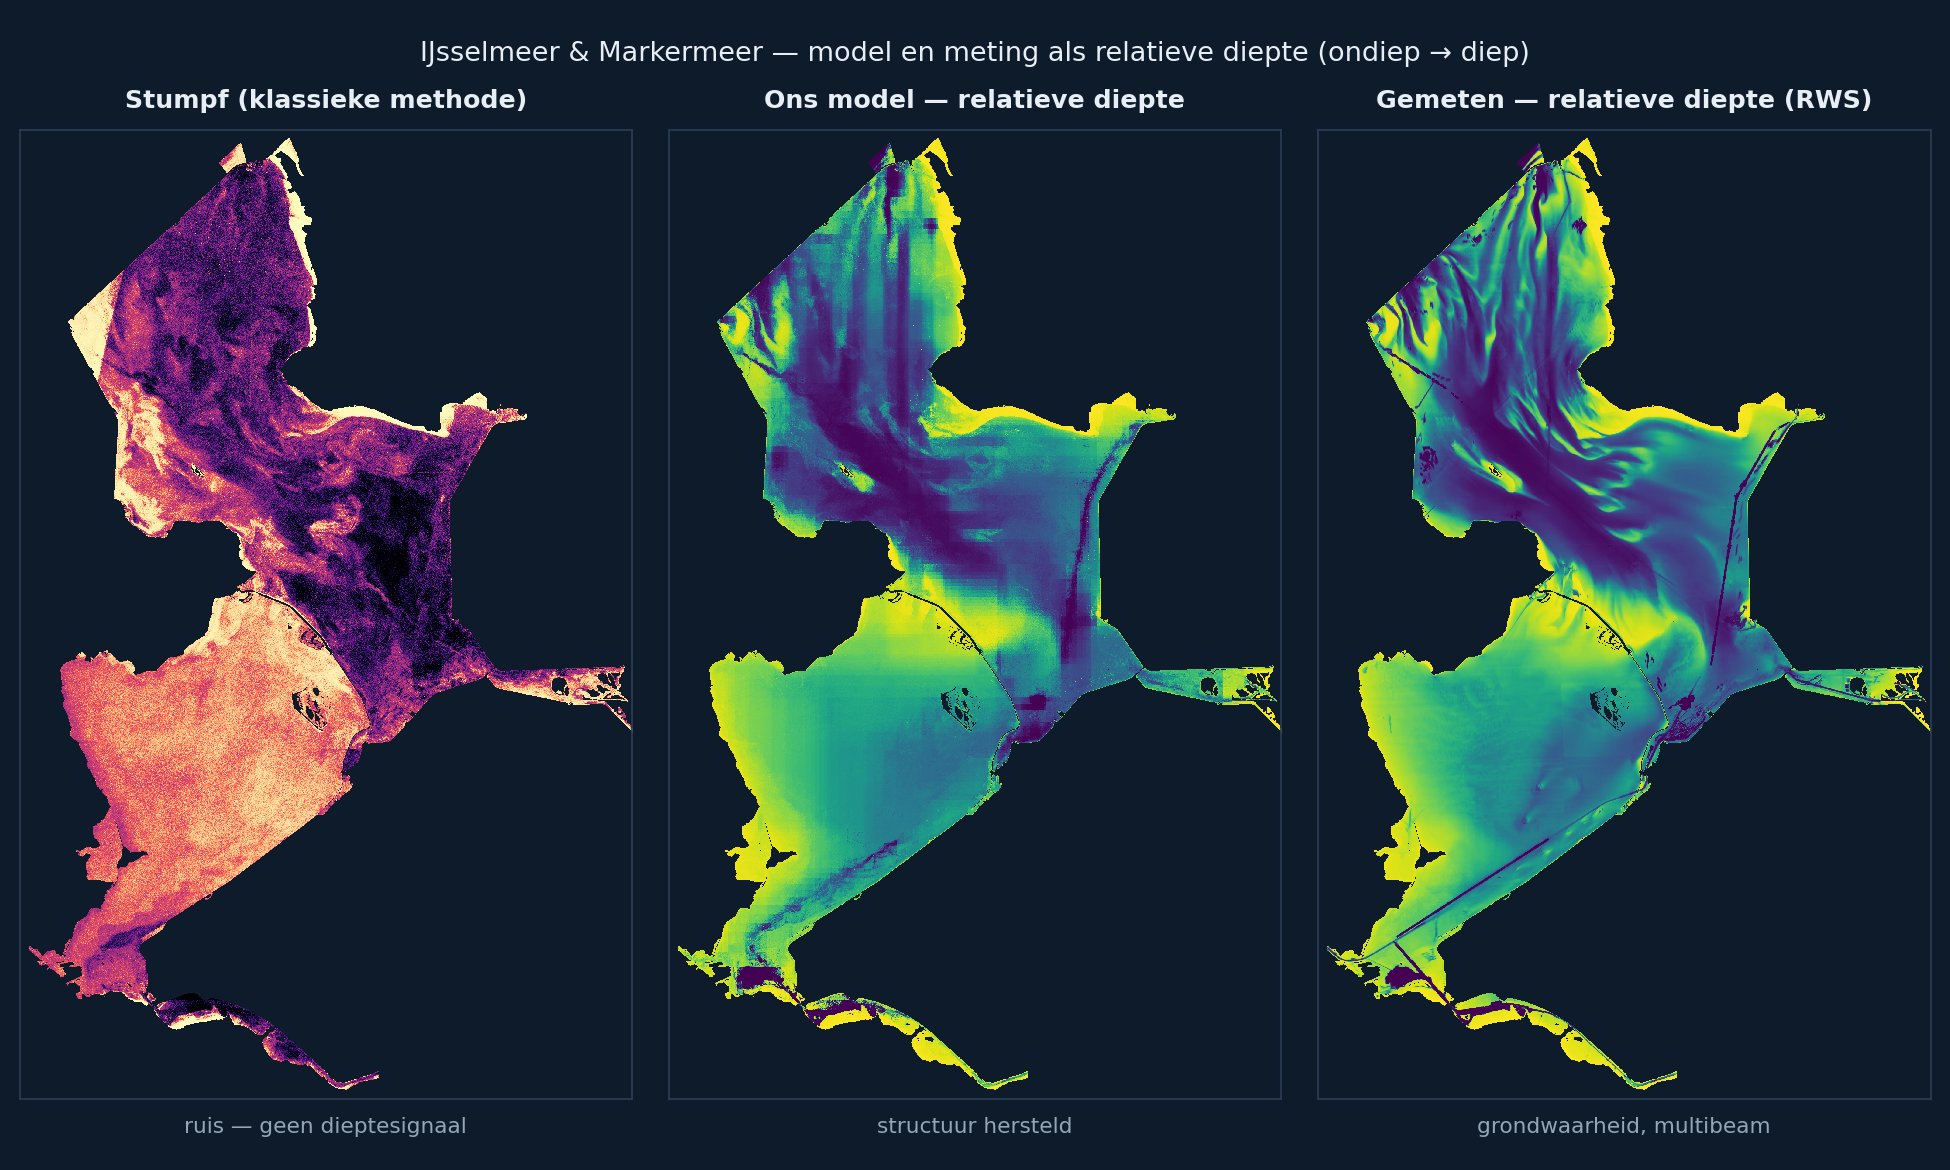
Depth may be the single most important thing an angler wants to know — and the least available. For a handful of large waters, surveyed bathymetry exists; for the thousands of polder lakes, canals and peat pits in between, it doesn't. The question we set ourselves: can you get depth out of free satellite imagery, for the whole of the Netherlands?
The standard method — and where it comes from
The classic approach is called satellite-derived bathymetry (SDB). It uses the log-ratio of Sentinel-2's blue and green bands — the method Stumpf published in 2003. Deeper water attenuates blue and green differently, and that ratio should betray the depth. On clear coastal water near Ameland, Deltares reached an R² of 0.92 with it. We reproduced exactly that method and calibrated it against Rijkswaterstaat's multibeam surveys: the Algemeen Dieptebestand IJsselmeergebied, at 5-metre resolution.
Where it broke
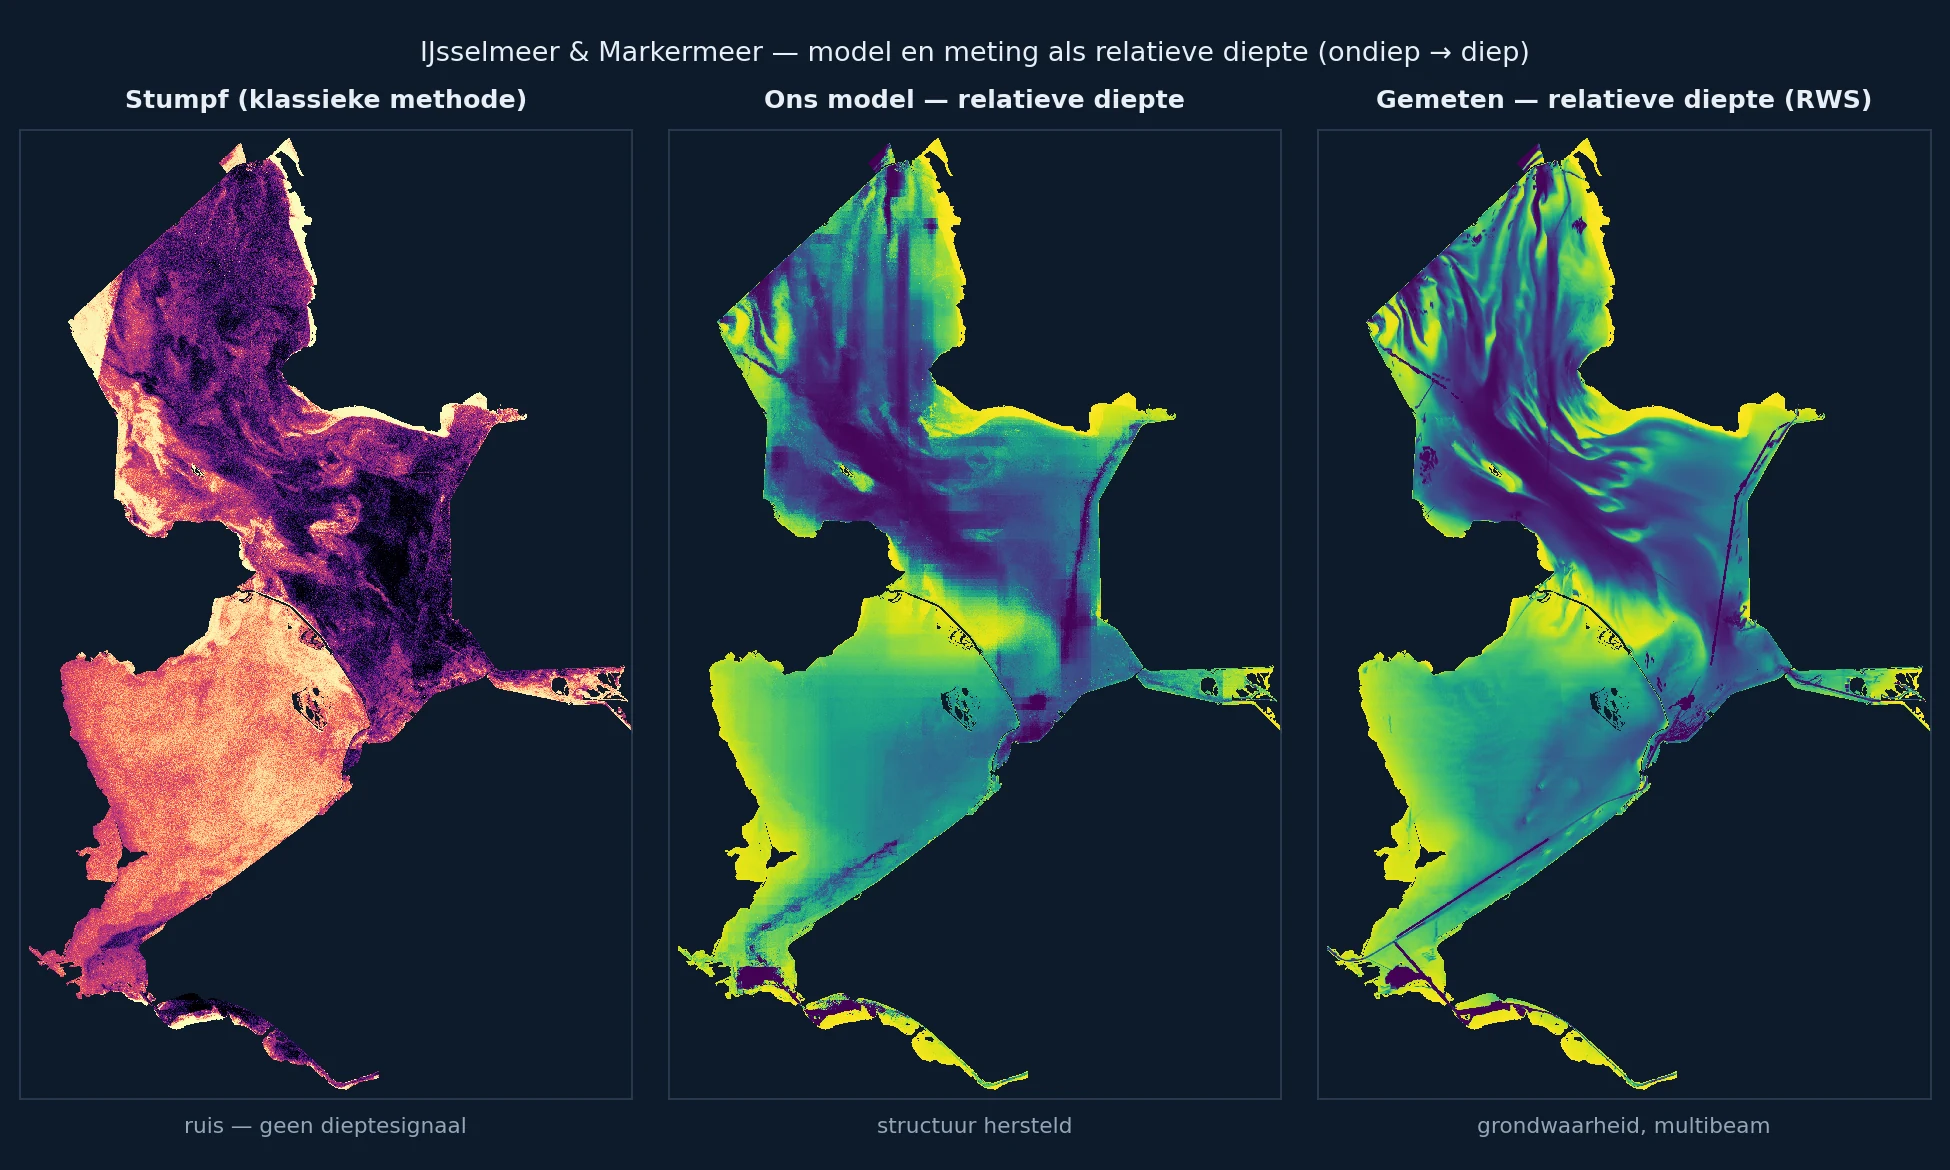
On Dutch inland water, the method fell over. On the IJsselmeer the relationship pointed one way; on the Markermeer, the other — a sign flip between two comparable lakes. A real depth signal would point the same way in both. That it didn't is the smoking gun: what the model picked up wasn't depth, but the water column itself — suspended sediment, humic acids, the colour of the water.
Back to first principles
When the off-the-shelf method fell over, we didn't just throw a bigger model at it. We went back to the physics and built it up from the ground: what exactly happens to a ray of light that enters the water? Every level we truly understood brought the prediction one step closer.
1. What the satellite actually sees
What the sensor picks up isn't depth — it's a sum of three things: light reflected off the surface, light scattered back by the water column (silt, algae, dissolved matter), and the small remainder that reached the bottom and came back attenuated. Only that last part carries depth. The whole game is fishing that remainder out.
2. Colour is a depth gauge
Water doesn't absorb every colour at the same rate. Red light is gone within a metre; green and blue reach deepest. So the ratio of how blue and green fade betrays the depth — that's the idea behind the classic method. Near-infrared barely enters the water, which makes it a perfect reference for 'what's surface and haze, and what's water'.
3. Only where light reaches the bed
From this follows the key boundary: depth can only be recovered where bottom photons return. In clear, shallow water that's everywhere; in turbid or deep water, almost nowhere. So the dividing line that matters isn't 'lake versus river' but the depth regime. Uniformly shallow water (1–4 m) is where the physics cooperates — which is exactly why it works on the Veluwe border lakes and not in the deep, variable IJsselmeer basin.
4. Not one formula, but the whole spectrum
The classic method squeezes everything into one ratio — a single rigid projection that throws away most of the signal. From first principles, depth is entangled with the water's colour across several bands at once. So we hand a model all the visible bands plus near-infrared, each a probe at a different penetration depth, and let it separate bottom from column itself. That's why our model on the raw bands beats the ratio — and why putting the old ratio back in made the model worse.
5. More than the picture: the shape of the water
A satellite image isn't everything the physics of a water body encodes. The shape itself says a lot: a long narrow ditch is shallow almost everywhere, a round sandpit is deep in the middle. So we added more than the colours — the geometry of each water body (area, elongation, islands, the polygon boundary), the position in the grid, the curvature and slope of the bottom where we know it, the LIDAR height of the banks, even river flow.
And here we learned the biggest lesson: more physics data is not automatically better. When we stacked layers on blindly, generalisation actually dropped. First principles were the referee — keep what physically carries the signal, prune the rest. Position does most of the work locally (depth is spatially autocorrelated); the polygon's shape sets the regime and keeps training clean (we train only on real water, not the floodplain beside it); and the curvature and channel edges we don't feed in — we pull them out as a separate layer, more on that next.
6. Measure the shape, not the metres
The last principle is about what matters to an angler. A fish doesn't care that a spot is 4.2 metres; it cares about the drop-off, the channel edge, the ridge. Structure is a gradient property — far more robust to recover than absolute metres. So we judge the model on whether its drop-offs land in the right place, and we extract a deterministic structure layer — slope, curvature, channel edges — straight from the measured depth. That shift, from 'how deep exactly' to 'where does the bottom change', is what finally made the result useful on the water.
We thought we could do better
Instead of one rigid formula, we handed a gradient-boosting model the raw Sentinel-2 bands and let it find the relationships itself. Same calibration data, a strict spatial train/test split so that neighbouring pixels don't end up in both.
On unseen survey points it reached an R² of 0.53, a Spearman rank correlation of 0.75 and an RMSE of 0.58 metres — while the classic SDB can't even beat the mean here (R² around zero, slightly negative on the Markermeer). Better still: adding the Stumpf index as an extra feature made the model worse. The rigid log-ratio throws away information the learning model actually uses.
And then we tested ourselves to destruction
A good number is not a good model. The real question is: does it generalise? We trained on a set of waters and held one out entirely each time — leave-one-water-out, the strictest test there is.
For absolute depth in metres, generalisation failed. A model trained on four waters doesn't predict the fifth in metres. What does transfer is the rank order — shallow versus deep — but not the calibration. The model knows where it gets shallower, not by how much.
Where it does work
One family of waters sails through: the Veluwe border lakes — Veluwemeer, Wolderwijd, Nuldernauw, Eemmeer, Gooimeer. Shallow, similar in shape. There the same model reaches an R² around 0.6 and a Spearman around 0.84, tested by leave-one-out against RWS truth. Not because these lakes are magic, but because they're uniformly shallow — exactly the regime where the physics cooperates.
| Water | R² | Spearman |
|---|---|---|
| Veluwemeer | 0.85 | 0.93 |
| Wolderwijd | 0.80 | 0.92 |
| Nuldernauw | 0.73 | 0.89 |
| Gooimeer | 0.63 | 0.81 |
What we ultimately ship
The conclusion isn't 'satellite depth doesn't work'. It's more nuanced, and that nuance is exactly the point:
- Where Rijkswaterstaat has surveyed bathymetry, we use it directly — no model faking a worse version.
- On top of that we lay a deterministic structure layer: slopes, drop-offs, channel edges and shallows, derived straight from the surveyed depth.
- For the Veluwe border lakes we ship the modelled depth, validated by leave-one-out.
- Every depth map is labelled: 'surveyed' or 'modelled'. We never sell one as the other.
That's why the lake pages show depth where we can justify it, and stay silent where we can't. A blank space is more honest than an invented number.
Status: closed. The classic SDB code stays in the repo as a benchmark — if a future method beats it, we'll know immediately.
Updated: July 9, 2026