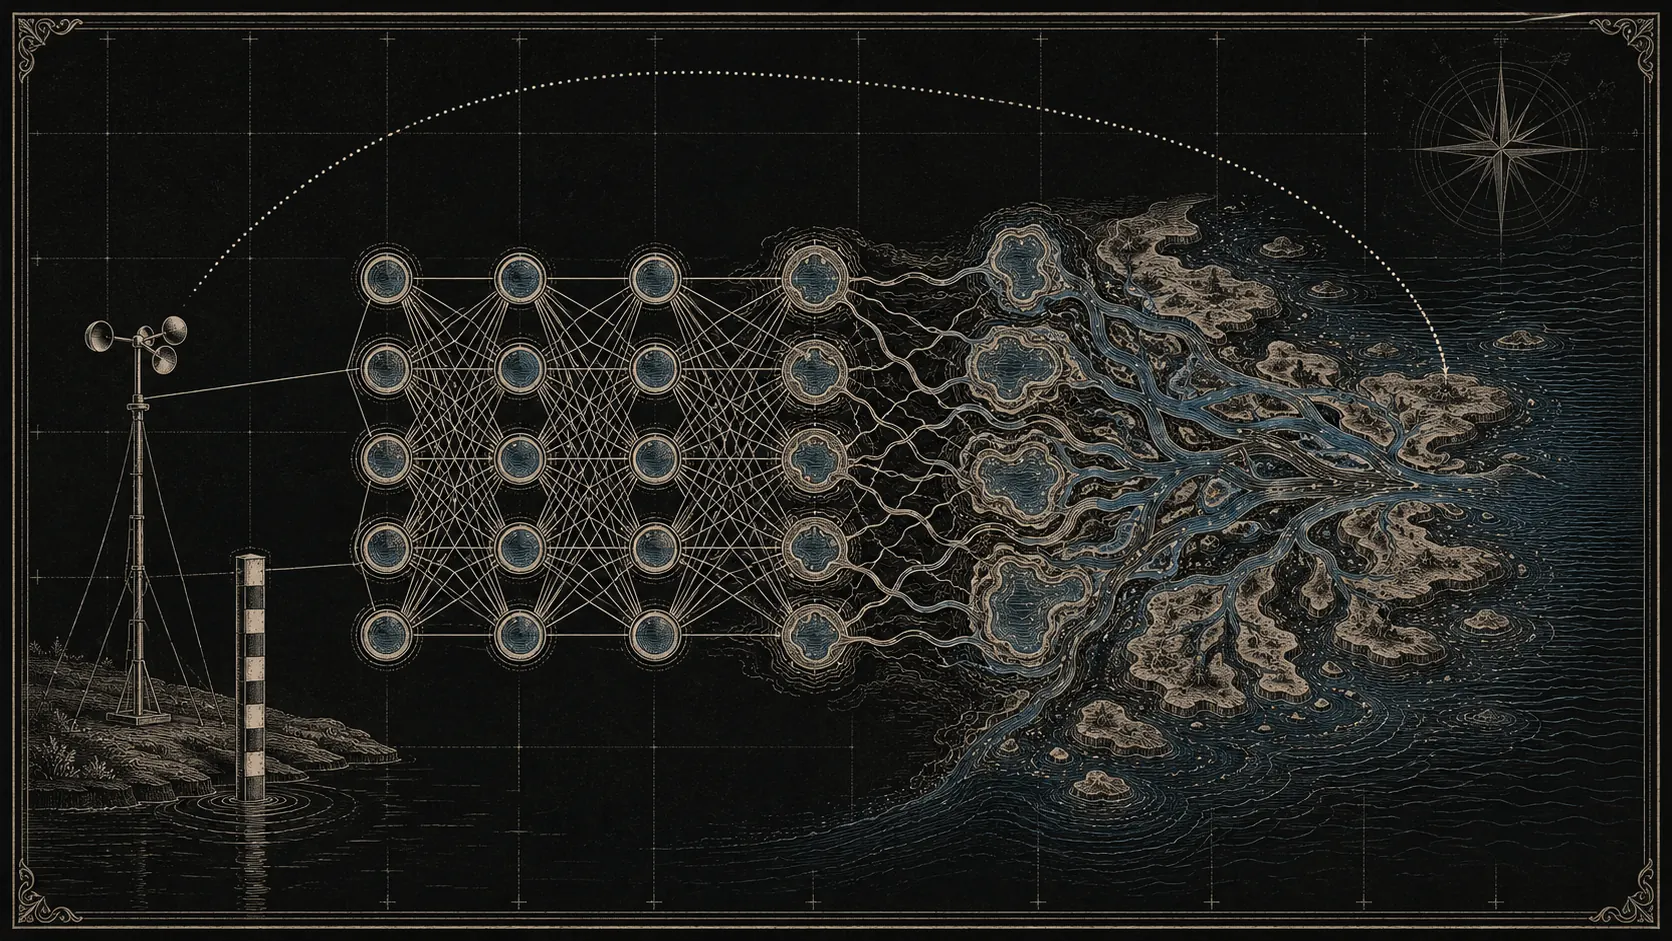
We built a model to answer one question: when do fish bite? For two weeks it confidently answered two entirely different ones. It knew what weather anglers like to go out in, and it knew which spots are good. Both are predictable. Neither is what we sell. This is the story of being wrong five times, and of the page we rebuilt on what survived.
Wind 'dominated' until we looked at where the blank days came from
Our model called wind the single biggest driver, at roughly half of everything. It was in our documentation, our species descriptions, our FAQ. It felt right too. Every angler has an opinion about wind.
It was an accident of how we picked the blank days, the days on which nobody caught anything. Those negative examples were drawn from any day we had weather for, and on most of those days nobody was fishing at all. So the model was partly learning something else entirely: where and when do anglers turn up, which is very predictable.
Wind was the variable that could carry it. Of all the weather we measure, wind is the most spatially structured in the Netherlands: a large share of its variance sits between places rather than between days. Temperature is almost purely temporal. So wind was not predicting fish. It was a proxy for the coastline, and the coastline was a proxy for human behaviour.
The fix comes from species-distribution modelling: draw negatives only from days when an angler was demonstrably out and reported something, just not the species in question. Wind fell from about half the model to a few percent, and has stayed there through every training run since.
The water level that was really an altimeter
Water level was our second driver. We were feeding the model centimetres above NAP, the Dutch ordnance datum. But a gauge on the Meuse near the German border sits at a completely different absolute height from one in a polder below sea level, and we measured the gap: the spread between stations dwarfed the spread within a station over time.
"Water level" was mostly telling the model which gauge it was looking at: geography again, this time in a hydrology costume. Once we switched to a datum-free three-day change, it dropped to a few percent nationally. It remains genuinely important for some river species; for dace it is still the single strongest driver.
Then we measured within the month
With both mistakes fixed, the models still looked strong. Pike scored 8.6×: its best-rated days produced eight times the catch rate of its worst. Then we asked a fairer question. Nobody chooses between January and July; you choose between Saturday and Sunday. Measured within a calendar month, which strips the season and leaves the conditions, pike's 8.6× became 1.59×. Bream came out at 0.9995. That is chance, to four decimal places.
Bream doesn't care. You can always catch those cows.
— said before any of it was measured
Our general model was ranking lakes
Our species-agnostic "is today a good day" model had no within-month skill at all. Pooling only the species that had demonstrated day-level skill repaired it, and the model earned the right to talk about days for the first time. It was geography. Again. The proof was blunt: a ranker that knows only which water it is, no weather and no dates, scored 3.93 on the same measure. Our weather model scored 1.26. Hold the water fixed as well as the season, and the day signal came to 1.03, which is nothing.
The over-correction, and what it repaired
Fooled four times, we did what burned people do and tightened everything. Carp, one of our largest datasets, fell to chance, and we concluded carp had no day signal.
We have so many catches, we ran so many separate tests. It just keeps throwing more tests at it until there's nothing left breathing.
— and that was the right call
That moment matters, because "I don't like the answer" and "the test is wrong" look identical from the inside. What settled it was our own briefs. Every brief we gave a reviewer said find what is wrong, and not once did we ask is this test too strict? A critic that is never required to justify its own severity will ratchet until nothing survives. We built that ratchet ourselves.
Geography was never the contaminant. It was the missing variable.
A carp in the canal would never notice the water level changing, or the temperature changing, the way one in a closed-off city pond would.
That is not a preference about statistics. It is a mechanism, and it makes a prediction. If carp respond to weather one way in a small stagnant pond and barely at all in a flowing canal, a single model fitted to both must split the difference. It lands in the middle and fits neither. The effect can be real in every subgroup and near-zero in aggregate. That is exactly the shape of what we were seeing.
| Species | Within-month skill | Habitat |
|---|---|---|
| Gudgeon | 1.57 | rivers and streams only |
| Sole | 1.55 | sea only |
| Dab | 1.42 | sea only |
| Whiting | 1.40 | sea only |
| Pike | 1.38 | everywhere |
| Perch | 1.21 | everywhere |
| Carp | 1.13 | everywhere |
| Roach | 1.10 | everywhere |
Every single-habitat species is at the top. Every generalist is at the bottom. The sea fish and the river fish were never better modelled. They were simply undiluted: they only live in one kind of water, so there was nothing to average away.
What the page became
The forecast page was rebuilt around what was still standing after all that pruning. In short: season is the big measured signal and the day is the small one. At a fixed water the month is worth tens of percent and the day a few. A page that led with the day would put the wrong lever first.
- Season sets the level, the day sets the variation. One merged number per species per day, rather than two scores you have to reconcile yourself.
- A species with no measured day pattern gets no seven differing cells. Seven cells that differ only by rounding still read as a comparison, and that would be a claim we do not have.
- Percentages compare a species with its own annual average, not with other species. Which species is caught most often is a different question, answered by the sentence at the top of the page.
- The fishing year — the monthly index for every species — is national, model-free and public. It does not move with today's weather.
The things that do carry the forecast are plainer. Season sets the level, water temperature is the largest single factor after it, and the day itself moves that level by only a few percent.
What this is worth
Being publicly wrong five times is an odd sales pitch. But the alternative was to keep shipping a fifty-percent wind driver that was really the shape of a coastline, and that would have cost you time on the water, not us.
Status: closed. The forecast page has been rebuilt on what survived. The split by water type is still small and the figures shift with every retrain: enough to trust the direction, not yet enough to publish as fact. Closed here means we stopped, not that we are finished. We will pick this research up again when a new approach stands up to the same scrutiny that dismantled the old answers, and that will mostly take more data.
Updated: August 22, 2026