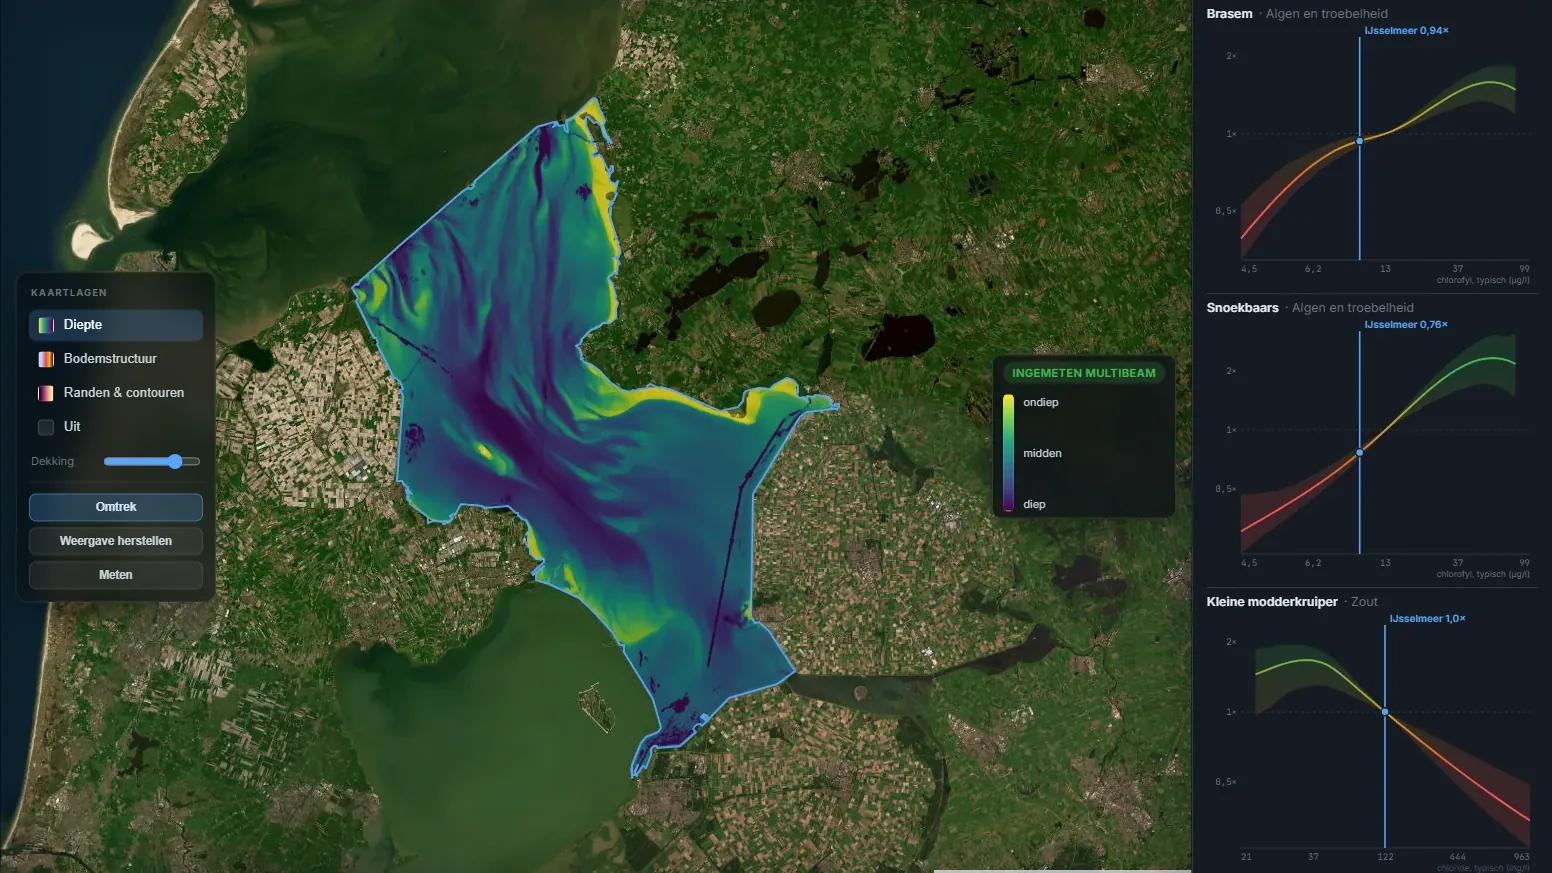
The question sounded simple: can you tell from the water whether a fish species will grow or shrink? With phosphate, oxygen, salt and clarity in hand, you could then say where zander are about to do better or worse. The answer was no. What we did find along the way is now on the lake and species pages: which fish you find in which water.
The first question: is a species growing or shrinking?
We took the fish surveys of Rijkswaterstaat and the Dutch water boards (LEW, the national water quality survey) and paired them up: the same spot, the same net, a few years apart. In between lay the measurements from the Waterkwaliteitsportaal, the national water quality portal. The question for the model: did the species decline, stay level or increase?
Not a single species made it. What did predict was the count at the first survey: a high count tends to fall and a low one to rise. That is regression to the mean, and it has nothing to do with the water.
Was it the method? No. A comparison within the same places did find that water with more phosphate grows more algae, exactly as it should. That approach sees a link when there is one. For fish, measured one survey at a time, the link between a change in the water and a change in the fish is too small to see: at most about ten percent more or fewer fish for an ordinary change in the water.
We tried a lot more: the worst moment between two surveys, toxic ammonia, exceeded limits, several measures at once. One candidate seemed to work: where the water's conductivity rose (more dissolved salts), perch declined faster than expected. On new surveys from 2024 and 2025 that link did not come back.
A different question: which fish lives in which water?
So we turned the question around: not how a species changes, but in which water you find it. That suits the water itself. We later measured that of all the variation in the measurements, only 4 to 21 percent lies within one water; the rest lies between waters. So the water mostly tells you what kind of place it is.
For that we joined two sources: the LEW fish surveys and the fish data that also sits in the files of the water quality portal. For every survey we looked up water measurements from as close as possible: the same spot, the same water, or similar water nearby.
The seven measures are nutrients, algae and turbidity, salt, hardness (calcium), oxygen, organic matter and metals. One model looks at all 48 species at once and learns a curve per species and per measure: how the chance that a survey catches that species changes as the water gets more turbid, harder or saltier. Related species borrow from each other. A carp-family species starts from the curves of its family, of fish feeding at the same level of the food chain and of fish of the same size, and only departs from them where its own data say so. The net, the region, the year and the area fished count too, so that none of them is mistaken for the water.
Does it hold up?
A curve that only fits the data it was learned from is worth nothing. So we tested it three ways, each time on data the model had never seen.
The water helped in all three. It also held up when we accounted for the kind of water (a river is not a ditch) and for the water board. Less so for the water board: about 44 percent of what the water predicts overlaps with which board did the survey. A water board is a landscape, but also a way of surveying, and the two cannot be pulled apart.
A second check: what is already known. From the specialist literature we collected 253 statements about these species. They held 40 directions we could compare: four agreed, none contradicted us, and on 36 our data could not say. For aquatic plants, where STOWA publishes a profile per species, 16 of 17 curves agreed with STOWA and none contradicted it. That is partly circular: STOWA uses some of the same Dutch data.
And what the water does not tell you: how many fish there are. The number of fish per survey did not hold up on new data. The water tells you mainly where you find a species, hardly how many.
What did not hold up
The original idea was called bloom and bust: per species a curve that rises, peaks and falls again, with a best value in the middle. We did find such humps: nine of the 36 curves that passed the first test. But none held in every part of the test when we split the regions in other ways.
Perch's hump along algae turned out to be a ghost. In the clearest water the algae reading was missing far more often than in green water, and where it was missing, perch was caught less often. That pulled the clear end of the curve down, and a hump appeared. With real readings only, perch simply falls one way: from 96 percent of surveys at the clear end to 75 percent at the green end.
The humps of round goby and monkey goby along calcium are real in the raw data, and the monkey goby's hump shows up again in a second dataset. But they say more about the kind of place, stony canals and rivers against peat polders, than about where the fish does best. So we name no 'best value' anywhere. Three curves with a hump are on the pages, dashed (round goby along calcium, stone loach along organic matter, white bream along oxygen). They show where a species is caught more often, not where it does best.
On truly salt and brackish water we could say nothing. Nearly all surveys there used one type of net that is not used in fresh water. The net and the salt then cannot be pulled apart. The salt curves on the pages therefore cover fresh to slightly brackish water only.
- Size: where big fish turn up more often. The pattern was there in the raw data, but the model did not hold on new data. No curve.
- Other life as the measure: plants, invertebrates and other fish. Together they helped, but no single link held under every way of dealing the regions.
- Young and adult fish apart: not better in every test.
- Change within one water: a water's older measurements predict almost as well as its newer ones. What counts is the water, not the change.
- Temperature and water-plant cover as extra measures: did not pass every test. Without one incomplete survey programme they did, but the rule had been fixed in advance.
What is on the pages
A curve is shown when it meets all four of these:
- It predicts better on average in regions the model did not know, on surveys where every measurement was really taken, under every way we split the regions.
- It beats geography alone. We tested that with made-up data in which the water has no effect at all.
- It has a clear shape on the part that is drawn, and the raw data do not point the other way.
- There are enough catches near the middle of the scale.
If a curve also survives the strictest version of these tests and the checks for the kind of water and the water board, and the raw data and a second dataset confirm it, it is drawn solid. The others are dashed, tagged less certain. At this release that makes 38 curves for 26 species, 7 of them solid. We chose this rule after the results were in. It is a rule for what we show, not a test we fixed in advance.
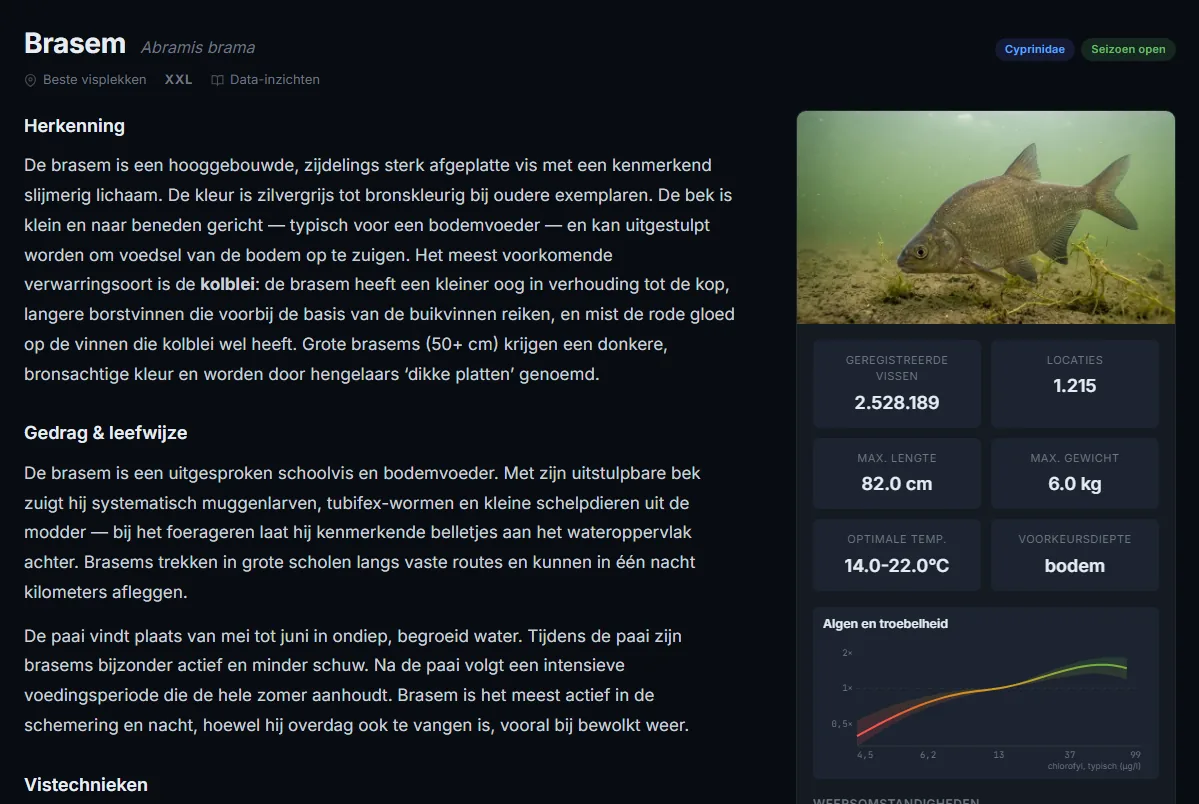
How to read a curve. The line is the odds that a survey catches the species, compared with the middle of the scale (1×). Green is more often, red less often, and the band around it shows how sure the line is. On a lake page a blue line marks where that lake sits. A curve says how often a species is caught, not how many fish there are, and never that a species 'prefers' anything.
The strongest results
Bream is caught more often in greener, more turbid water. In the older Piscaria data, which the model never saw, 59 percent of surveys in the clearest fifth caught bream, and 84 percent in the greenest.
Zander too, and more strongly: from 27 to 57 percent. For zander the link sits mainly in the turbidity itself, the suspended particles, not in the algae alone.
Stone loach is the other way round: clear water. In Piscaria from 16 percent in the clearest fifth to almost none in the greenest. Within brooks alone this link does not hold. It is about the difference between brooks and other water.
What we learned
- One survey is a snapshot with a factor of three uncertainty. For trends you need more than two moments.
- Show a model the level at two moments and it learns the place, not the change.
- Test your rules first on made-up data with a known answer. Two of our first rules 'found' something in pure noise about one time in five.
- Whether something was measured can say more than the measurement itself.
- Judge what you draw, not what you fitted. Judging only the drawn part of each curve dropped 8 of 46.
- A hump in a curve can be a landscape, not a preference.
Status: closed. The curves are on the IJsselmeer, the Zwarte Meer and the species pages, for example bream, zander and stone loach. Still open: salt water, which needs surveys with other gear, and change within one water: one survey at a time is too noisy for that, and it needs more surveys per water or more years.